. 2008 Jan 7;275(1630):91-100.
doi: 10.1098/rspb.2007.1137.

Robustness and evolvability: a paradox resolved

Affiliations

Robustness and evolvability: a paradox resolved

Andreas Wagner. Proc Biol Sci. .

Abstract

Understanding the relationship between robustness and evolvability is key to understand how living things can withstand mutations, while producing ample variation that leads to evolutionary innovations. Mutational robustness and evolvability, a system's ability to produce heritable variation, harbour a paradoxical tension. On one hand, high robustness implies low production of heritable phenotypic variation. On the other hand, both experimental and computational analyses of neutral networks indicate that robustness enhances evolvability. I here resolve this tension using RNA genotypes and their secondary structure phenotypes as a study system. To resolve the tension, one must distinguish between robustness of a genotype and a phenotype. I confirm that genotype (sequence) robustness and evolvability share an antagonistic relationship. In stark contrast, phenotype (structure) robustness promotes structure evolvability. A consequence is that finite populations of sequences with a robust phenotype can access large amounts of phenotypic variation while spreading through a neutral network. Population-level processes and phenotypes rather than individual sequences are key to understand the relationship between robustness and evolvability. My observations may apply to other genetic systems where many connected genotypes produce the same phenotypes.


Figures

Figure 1
Figure 1
(a) The number of sequences folding into one structure has a highly skewed distribution. Structures found in a random sample of 106 sequences were ranked according to their frequency, defined as the number of sequences in the sample that adopt a structure divided by 106. The plot shows structure rank (x-axis) plotted against structure frequency (y-axis). Note the logarithmic scale on the y-axis. Structure frequencies vary by more than a factor 103 in this sample. (b) High genotype robustness implies low genotype evolvability. Data shown are based on 7.5×10⁴ different RNA structures (n=30 nucleotides) whose frequencies span three orders of magnitude, and on one RNA sequence inversely folded for each structure. Genotype robustness (rG) and evolvability (eG) were calculated for these inversely folded RNA sequences. Lengths of error bars indicate one standard error of the mean, calculated for each of the 20 bins of data grouped according to rG. Bars are too short to be visible for most of the data points. Standard deviations were below 0.13 for all 20 bins. The dashed line indicates points where eG=1−rG. Note that 1−rG is the fraction of sequences in the 1-neighbourhood of a sequence G, that have an MFE secondary structure different from that of G.
Figure 2
Figure 2
(a) High phenotype robustness implies high phenotype evolvability. For any one structure, the estimate of evolvability (eP) used here is the total number U of structures different from each other that were found in the 1-neighbourhood of k=100 inversely folded sequences, multiplied by the structure frequency f. (b) Histogram of the ratio Q (see main text) indicating how many structures in the 1-neighbourhoods of k (=100) sequences are different from each other. Q ranges from Q=1/k, if the k neighbourhoods are identical in their structure content, to a value of Q=1, if no two structures in any two 1-neighbourhoods are identical. The median of Q is greater than 1/2, indicating that the majority of structures in different 1-neighbourhoods are different. (c) The ratio Q increases with structure frequency, indicating that the neighbourhood of a sequence folding into a structure with a larger neutral network contains greater number of structures unique to this neighbourhood. Data shown are based on the 2.5×10⁴ different RNA structures (n=30 nucleotides) with the highest ranking from figure 1, and on k=100 inversely folded RNA sequences for each structure. Error bars indicate one standard error. (d) Mutational robustness rG varies among sequences inversely folded from different structures. Data shown are based on 7.5×10⁴ different RNA structures (n=30 nucleotides) whose frequencies span three orders of magnitude, and on one inversely folded RNA sequence for each structure.
Figure 3
Figure 3
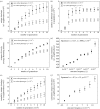
Populations evolving on a large neutral network (robust phenotype) have access to greater amounts of phenotypic variation. (a) Numbers of unique structures in the 1-neighbourhood of evolving populations, (b) numbers of different sequences in the population and (c) pairwise Hamming distance among sequences in the population, as a function of the number of generations of evolution (x-axes) on a neutral network. Open and filled circles in (ac) correspond to populations with less and more robust phenotypes, respectively. Data are based on 20 inversely folded sequences per structure and on populations of size N=500 (μ=1). (d) Mean (circles) and standard errors (bars) of numbers of unique structures (y-axis) in the 1-neighbourhood of populations that have evolved for 10 generations on a neutral network associated with structures whose frequency is shown on the x-axis. Data in (d) are based on 4000 different structures ranging in frequency from 3.3×10⁻⁵ to 1.7×10⁻³, and on one inversely folded sequence per structure that is used to seed a population size of N=100. Circles and bars indicate means and one standard error. (e) Same as (a), but for populations with N=10 and μ=0.01. Also, the y-axis in (e) shows the cumulative number of unique structure, i.e. unique structures that occurred in the 1-neighbourhood of all genotypes that the population encountered between generation zero and the time shown on the x-axis. Note that because =0.1, a new genotype arises that will come to dominate the population only once in every 10 generations (Kimura 1983), implying that the exploration of the network by such a population is necessarily slower. As one would expect, the 1-neighbourhoods of the starting genotypes contained fewer unique phenotypes for the robust starting phenotype than for the less robust starting phenotype (0.33 versus 0.30), and these genotypes were also more robust (rG=0.48 versus rG=0.27). (f) Mean (circles) and standard errors (bars) of the cumulative number of unique structures (y-axis) in the 1-neighbourhood of populations that have evolved for 104 generations on a neutral network associated with structures whose frequency is shown on the x-axis. Data in (f) is based on 1500 different structures ranging in frequency from 7.4×10⁻⁵ to 1.7×10⁻³, and on one inversely folded sequence per structure that is used to seed a population size of N=10 and μ=0.01.
Figure 4
Figure 4
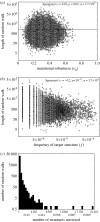
(a) Mutational robustness (x-axis) is not associated with the length of a random walk to a target structure (y-axis). (b) The frequency f of a target structure shows a weak negative association with the length of the random walk. (c) Distribution of the number of different secondary structures encountered during a random walk beginning from a sequence folding into a structure S to a sequence folding into a structure T. All data based on 3.7×10⁴ random structure pairs (S, T).

References

    1. Aharoni A, Gaidukov L, Khersonsky O, Gould S.M, Roodveldt C, Tawfik D.S. The ‘evolvability’ of promiscuous protein functions. Nat. Genet. 2005;37:73–76. - PubMed
    1. Ancel L.W, Fontana W. Plasticity, evolvability, and modularity in RNA. J. Exp. Zool./Mol. Dev. Evol. 2000;288:242–283. doi:10.1002/1097-010X(20001015)288:3<242::AID-JEZ5>3.0.CO;2-O - DOI - PubMed
    1. Baudin F, Marquet R, Isel C, Darlix J, Ehresmann B, Ehresmann C. Functional sites in the 5′ region of human-immunodeficiency-virus type-1 RNA form defined structural domains. J. Mol. Biol. 1993;229:382–397. doi:10.1006/jmbi.1993.1041 - DOI - PubMed
    1. Bedau M.A, Packard N.H. Evolution of evolvability via adaptation of mutation rates. Biosystems. 2003;69:143–162. doi:10.1016/S0303-2647(02)00137-5 - DOI - PubMed
    1. Bloom J.D, Labthavikul S.T, Otey C.R, Arnold F.H. Protein stability promotes evolvability. Proc. Natl Acad. Sci. USA. 2006;103:5869–5874. doi:10.1073/pnas.0510098103 - DOI - PMC - PubMed

Publication types

LinkOut - more resources