. 2008 Aug;67(8):1076-83.
doi: 10.1136/ard.2007.078048. Epub 2007 Oct 30.

CCL3L1 gene-containing segmental duplications and polymorphisms in CCR5 affect risk of systemic lupus erythaematosus

Affiliations

CCL3L1 gene-containing segmental duplications and polymorphisms in CCR5 affect risk of systemic lupus erythaematosus

M Mamtani et al. Ann Rheum Dis. 2008 Aug.

Abstract

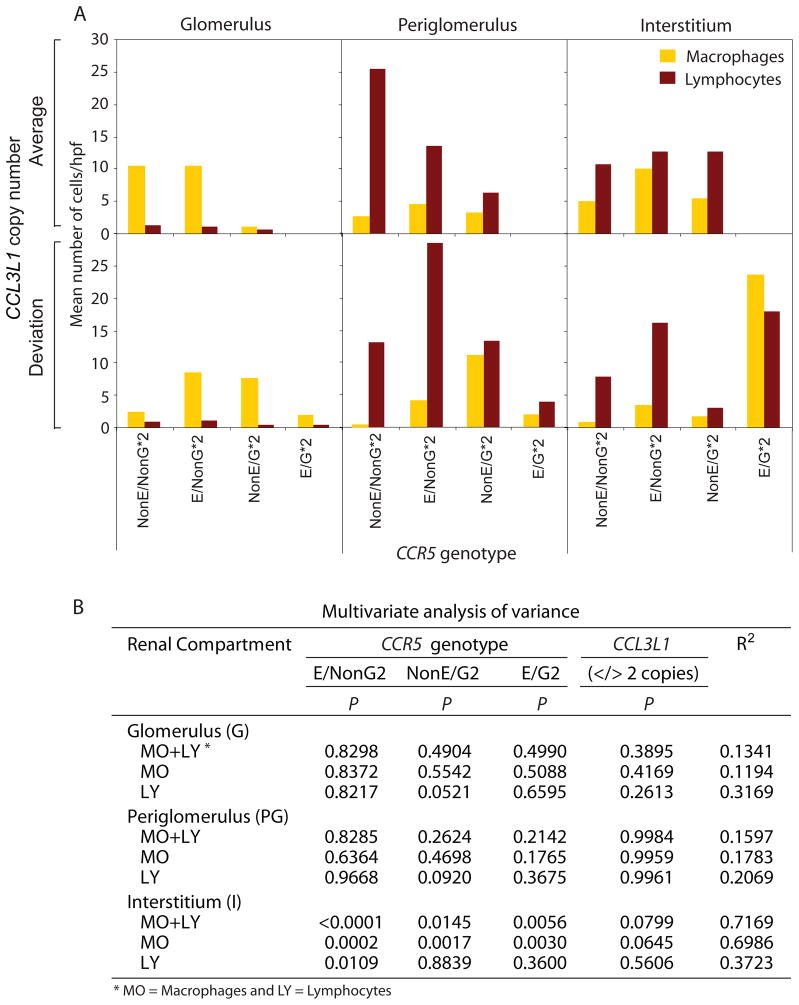
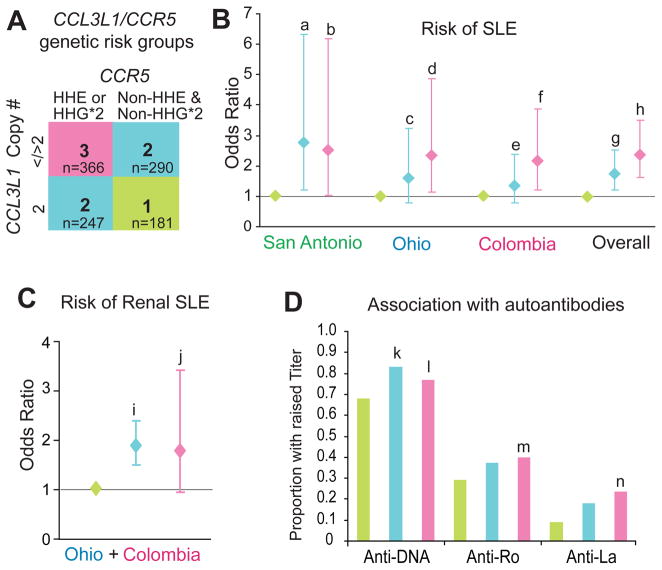
Objectives: There is an enrichment of immune response genes that are subject to copy number variations (CNVs). However, there is limited understanding of their impact on susceptibility to human diseases. CC chemokine ligand 3 like-1 (CCL3L1) is a potent ligand for the HIV coreceptor, CC chemokine receptor 5 (CCR5), and we have demonstrated previously an association between CCL3L1-gene containing segmental duplications and polymorphisms in CCR5 and HIV/AIDS susceptibility. Here, we determined the association between these genetic variations and risk of developing systemic lupus erythaematosus (SLE), differential recruitment of CD3+ and CD68+ leukocytes to the kidney, clinical severity of SLE reflected by autoantibody titres and the risk of renal complications in SLE.

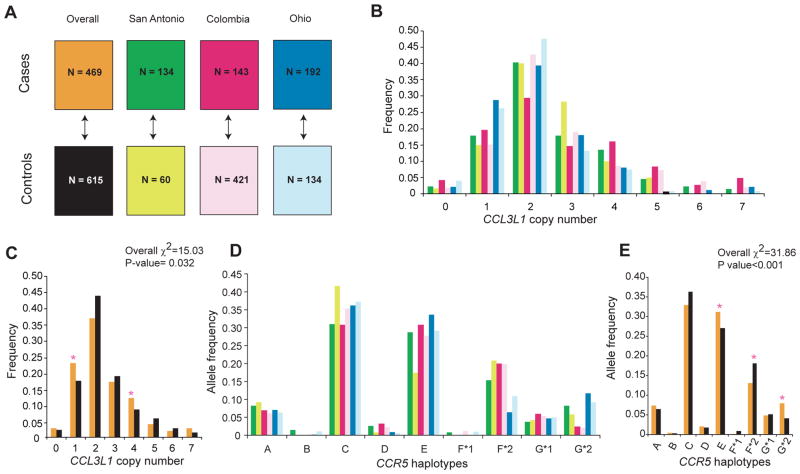
Methods: We genotyped 1084 subjects (469 cases of SLE and 615 matched controls with no autoimmune disease) from three geographically distinct cohorts for variations in CCL3L1 and CCR5.

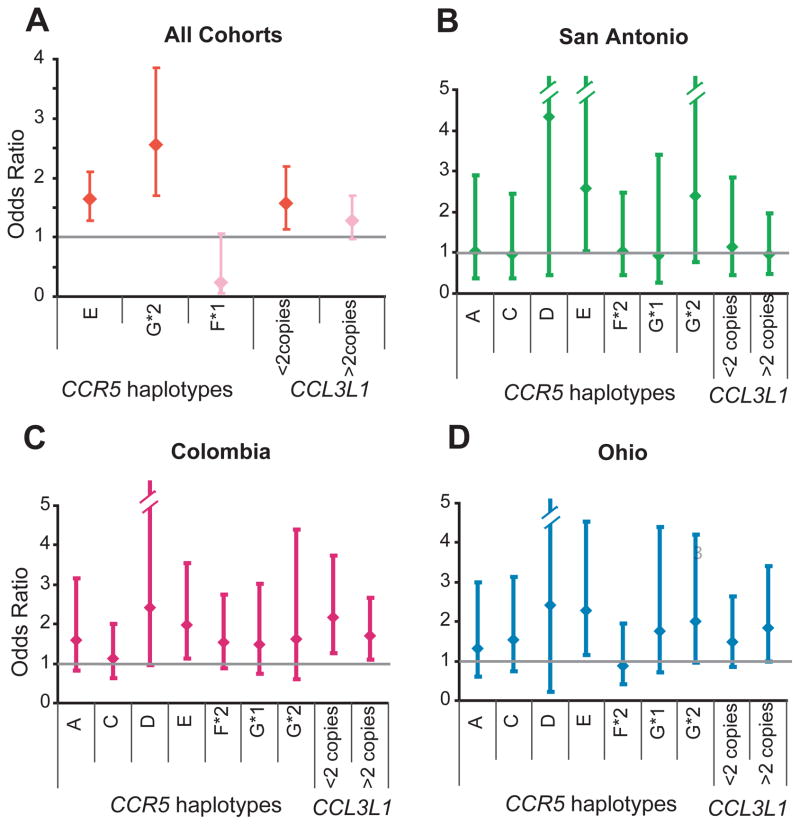
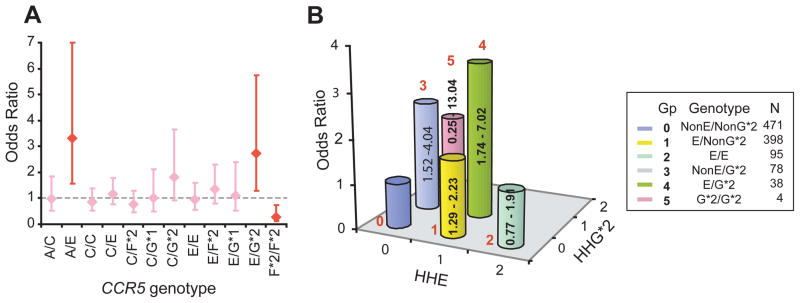
Results: Deviation from the average copy number of CCL3L1 found in European populations increased the risk of SLE and modified the SLE-influencing effects of CCR5 haplotypes. The CCR5 human haplogroup (HH)E and CCR5-Delta32-bearing HHG*2 haplotypes were associated with an increased risk of developing SLE. An individual's CCL3L1-CCR5 genotype strongly predicted the overall risk of SLE, high autoantibody titres, and lupus nephritis as well as the differential recruitment of leukocytes in subjects with lupus nephritis. The CCR5 HHE/HHG*2 genotype was associated with the maximal risk of developing SLE.

Conclusion: CCR5 haplotypes HHE and HHG*2 strongly influence the risk of SLE. The copy number of CCL3L1 influences risk of SLE and modifies the SLE-influencing effects associated with CCR5 genotypes. These findings implicate a key role of the CCL3L1-CCR5 axis in the pathogenesis of SLE.


Conflict of interest statement

Competing interests: None.

Figures

Figure 1
Figure 1
Study cohorts and distribution of CCL3L1 copy number and CCR5 haplotypes. A. Systemic lupus erythaematosus (SLE) cohorts. Cohorts were from three different geographic regions, namely San Antonio, Texas, USA, Columbus, Ohio, USA and Medellin, Colombia. n, number of study subjects. The up/down arrow indicates a set of cases being compared against the corresponding set of controls as well as between all cases and all controls. The colors corresponding to each study subset are used in the remaining panels. Overall, all subjects. B, C. Distribution of CCL3L1 copy number in each study cohort (B) and all cohorts combined (C). D, E. Distribution of CCR5 haplotypes in each study cohort (D) and all cohorts combined (E). The overall difference of distribution between cases and controls was tested for significance using the χ2 test. The asterisks indicate significance values for differences in the frequency of the indicated CCL3L1 copy number and CCR5 haplotypes between cases and controls. p Values for possessing one and four copies of CCL3L1 (C) were 0.012 and 0.020, whereas for possessing CCR5 human haplogroup (HH)E, HHF*2 and HHG*2 haplotypes (E) they were p=0.034, 0.002 and <0.001, respectively.
Figure 2
Figure 2
Copy number of CCL3L1 and CCR5 haplotypes influence risk of developing systemic lupus erythaematosus (SLE). Association between CCR5 haplotype or CCL3L1 copy number and the risk of developing SLE was determined by logistic regression analyses in all cohorts combined (A) and in each SLE cohort separately (B–D). The error bars indicate 95% CIs around the point estimates (diamonds). In (A), the results are from the final model of a stepwise logistic regression using a probability criterion of p<0.1 and red color indicates statistical significance whereas pink color indicates statistical non-significance.
Figure 3
Figure 3
CCR5 genotypes and risk of systemic lupus erythaematosus (SLE). A. Association between the 12 most common CCR5 genotypes and risk of developing SLE. The diamonds and error bars represent point and 95% confidence intervals of odds ratio, respectively. Red indicates statistical significance while pink indicates statistical non-significance. B. Interactive effects of CCR5 human haplogroup (HH)E and HHG*2 on the risk of developing SLE. The numbers in red indicate the six color-coded genotypic groups; n, number of subjects in each group (Gp). For example, those who possess HHE but not HHG*2 are designated as E/NonG*2. For this analysis, group 0 (those lacking HHE and HHG*2) was considered as the reference category. The height of the bar indicates the odds ratio of developing SLE and the numbers in the bar indicate 95% CI.
Figure 4
Figure 4
Association of CCL3L1–CCR5 genotypes with number of inflammatory cells in the indicated renal compartment in patients with lupus nephritis. A. Average number of inflammatory cells per high power field (hpf) in the indicated renal compartments stratified by CCL3L1– CCR5 genotype. The bars show mean number of cells/hpf. Macrophages (orange bars) and lymphocytes (brown bars) were identified by the presence of CD68 and CD3 markers, respectively. B. Results of multivariate analysis of variance (MANOVA) for association between CCL3L1–CCR5 genotypes with number of inflammatory cells in the indicated renal compartments. p Indicates the significance value estimated from the Snedecor F statistic and R2 indicates the variability explained by the full model including the CCL3L1–CCR5 genotypes. In this analysis non-HHE/non-HHG*2 was considered as the reference genotype for CCR5 and two copies was the reference category for CCL3L1.
Figure 5
Figure 5
Conjoint effects of CCR5 and CCL3L1 on systemic lupus erythaematosus (SLE) susceptibility, development of renal lupus and autoantibody titres. A. CCL3L1–CCR5 genotypic groups. Group 1 comprised of subjects who did not possess CCR5 human haplogroup (HH)E or HHG*2 (Non-HHE and Non-HHG*2) and had two copies of CCL3L1. Group 2 comprised of subjects who either (a) did not possess CCR5 HHE or HHG*2 (Non-HHE and Non- HHG*2) and had either <2 or >2 copies of CCL3L1, or (b) those who possessed HHE or HHG*2 and had two copies of CCL3L1. Group 3 comprised of subjects who possessed HHE or HHG*2 CCR5 haplotypes and had <2 or >2 copies of CCL3L1. The color codes for the indicated genotypic risk groups are used in the rest of the figure. B. Association of the genotypic risk groups with risk of SLE. For these analyses, group 1 in (A) was considered as the reference category. For each cohort the odds ratios were estimated in a single model by multivariate logistic regression analysis. Letters (a–h) indicate significance values: a, 0.015; b, 0.041; c, 0.187; d, 0.020; e, 0.283; f, 0.009; g, 0.002; h, <0.001. C. Association of CCL3L1–CCR5 genotypic risk groups with risk of lupus nephritis in patients with SLE from the Colombia and Ohio cohorts. Letters (i) and (j) indicate significance values: i, <0.001; j, 0.071. In (B) and (C) the diamonds and error bars represent point and 95% confidence intervals of odds ratio, respectively. D. Association of the CCL3L1–CCR5 genotypic risk groups and autoantibody titres. Letters (k–n) indicate significance values: k, 0.037; l, 0.006; m, <0.001; n, <0.001. The anti-Ro and anti-La data was not available for the San Antonio cohort. Statistical significance for results shown in (C) and (D) was assessed using clustered multinomial logistic regression analyses.

References

    1. Beckmann JS, Estivill X, Antonarakis SE. Copy number variants and genetic traits: closer to the resolution of phenotypic to genotypic variability. Nat Rev Genet. 2007;8:639–46. - PubMed
    1. Kehrer-Sawatzki H. What a difference copy number variation makes. Bioessays. 2007;29:311–3. - PubMed
    1. Redon R, Ishikawa S, Fitch KR, Feuk L, Perry GH, Andrews TD, et al. Global variation in copy number in the human genome. Nature. 2006;444:444–54. - PMC - PubMed
    1. Bailey JA, Gu Z, Clark RA, Reinert K, Samonte RV, Schwartz S, et al. Recent segmental duplications in the human genome. Science. 2002;297:1003–7. - PubMed
    1. Aitman TJ, Dong R, Vyse TJ, Norsworthy PJ, Johnson MD, Smith J, et al. Copy number polymorphism in Fcgr3 predisposes to glomerulonephritis in rats and humans. Nature. 2006;439:851–5. - PubMed

Publication types

MeSH terms