. 2008 Jan;294(1):E148-56.
doi: 10.1152/ajpendo.00211.2007. Epub 2007 Oct 30.

Berberine improves glucose metabolism through induction of glycolysis

Affiliations

Berberine improves glucose metabolism through induction of glycolysis

Jun Yin et al. Am J Physiol Endocrinol Metab. 2008 Jan.

Abstract

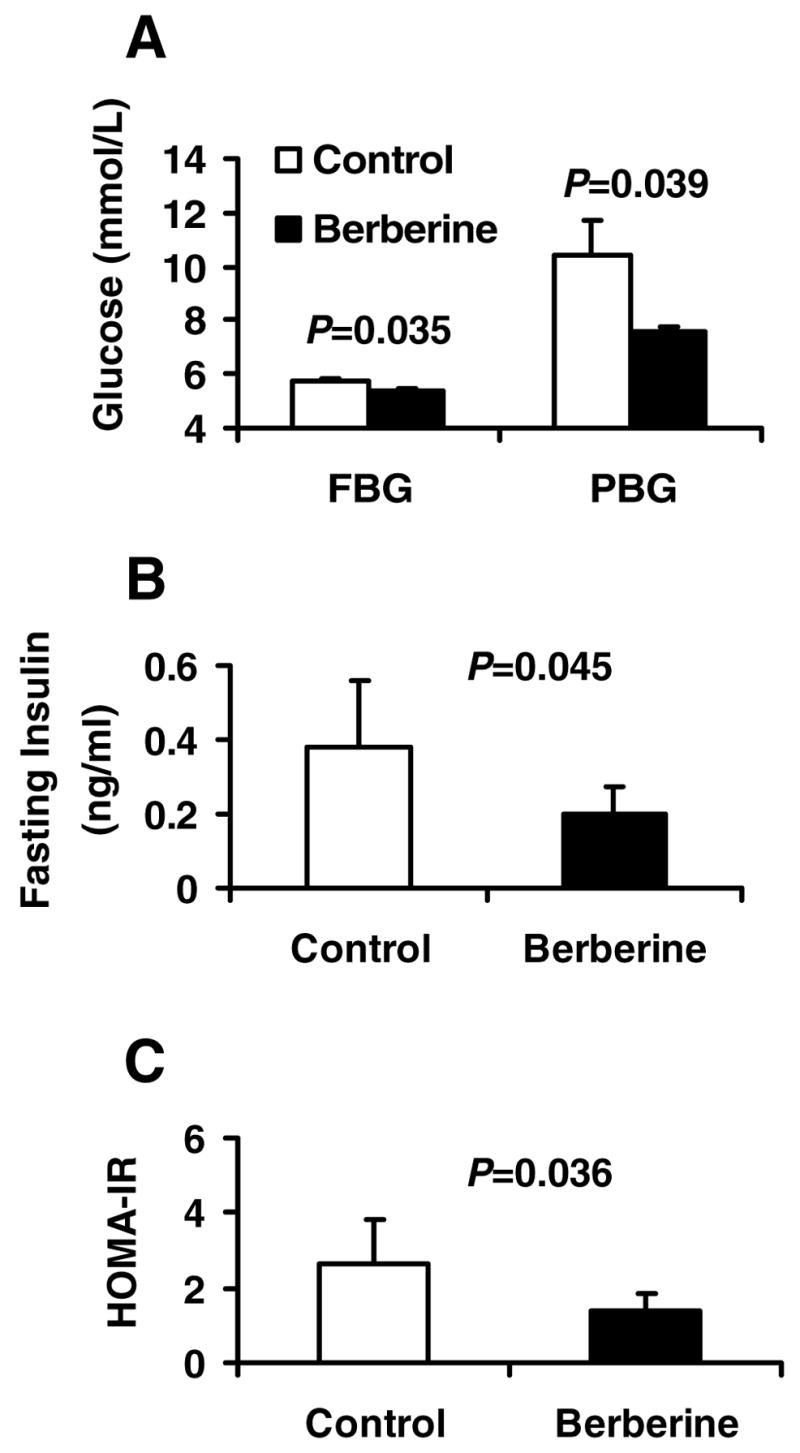
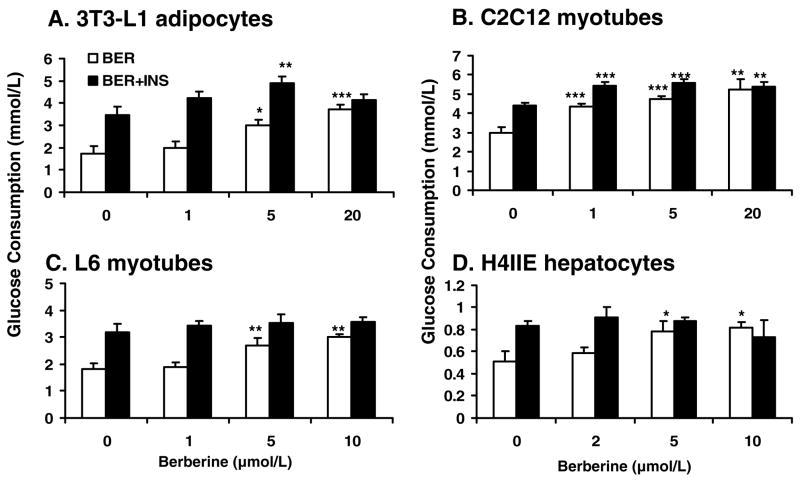
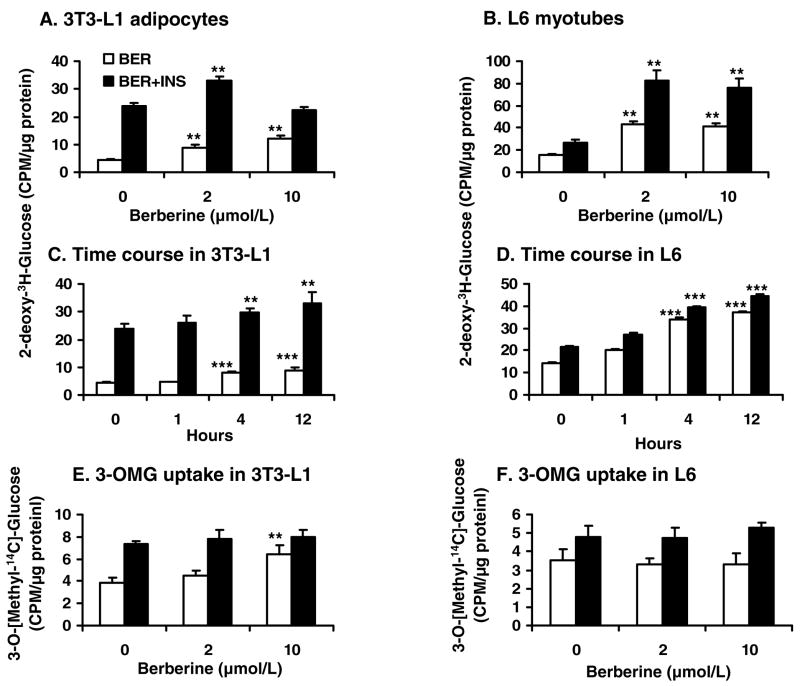
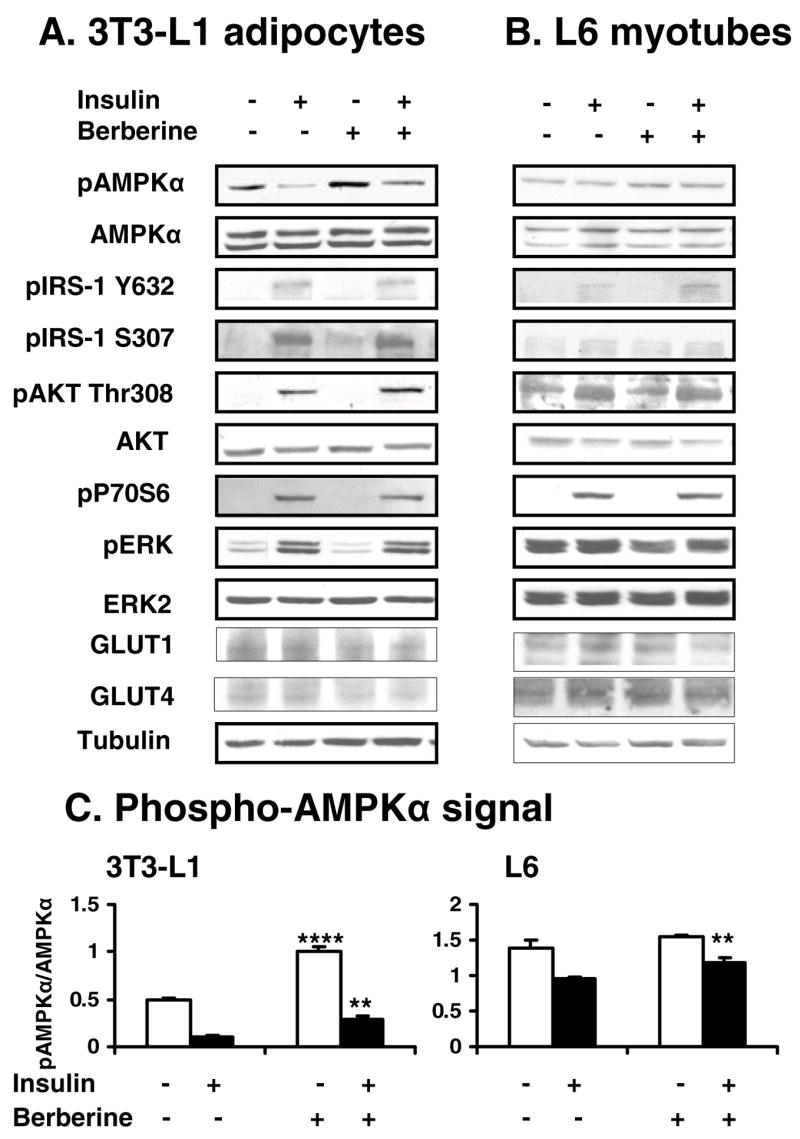
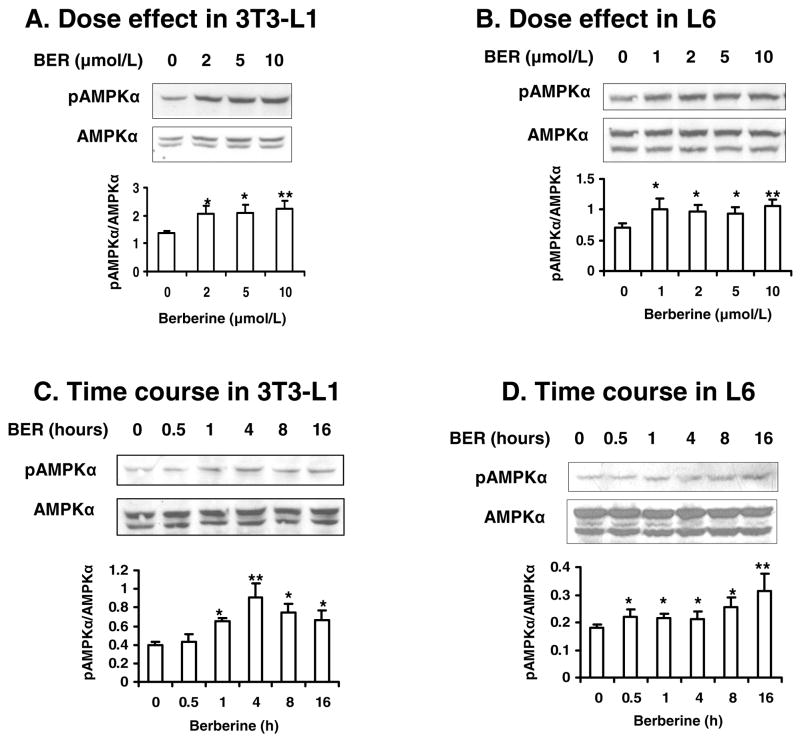
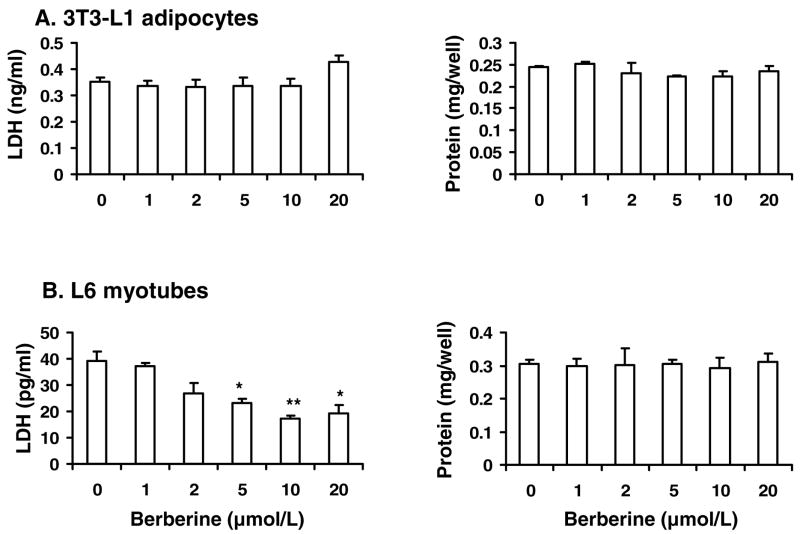
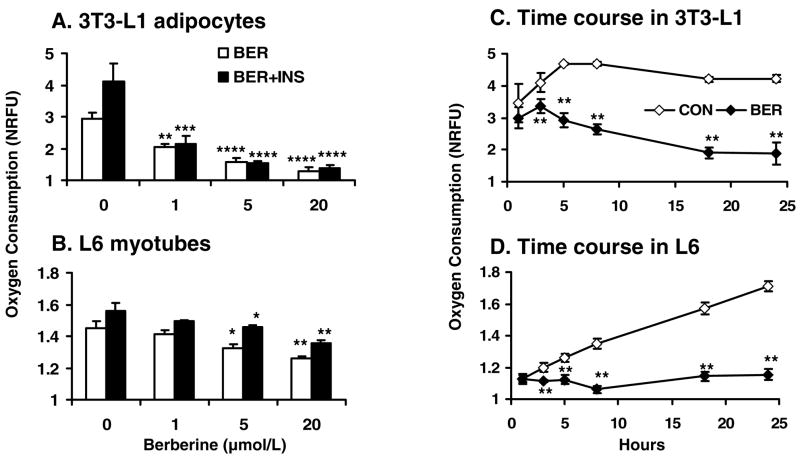
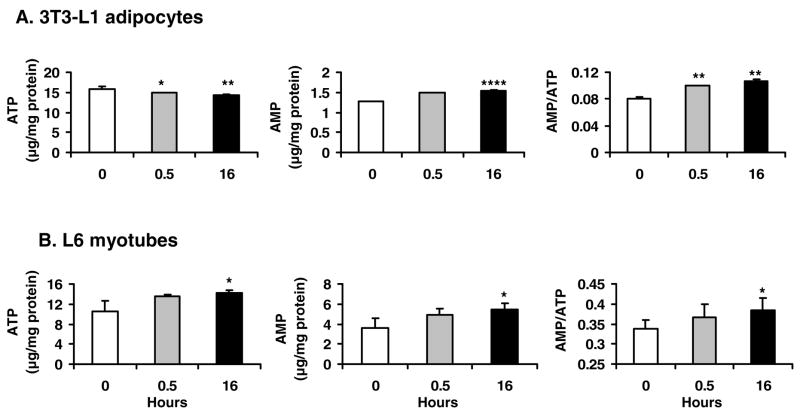
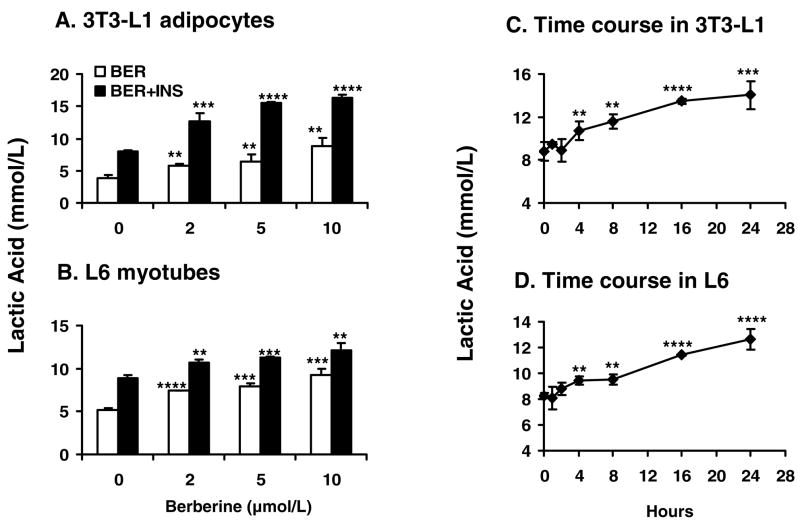
Berberine, a botanical alkaloid used to control blood glucose in type 2 diabetes in China, has recently been reported to activate AMPK. However, it is not clear how AMPK is activated by berberine. In this study, activity and action mechanism of berberine were investigated in vivo and in vitro. In dietary obese rats, berberine increased insulin sensitivity after 5-wk administration. Fasting insulin and HOMA-IR were decreased by 46 and 48%, respectively, in the rats. In cell lines including 3T3-L1 adipocytes, L6 myotubes, C2C12 myotubes, and H4IIE hepatocytes, berberine was found to increase glucose consumption, 2-deoxyglucose uptake, and to a less degree 3-O-methylglucose (3-OMG) uptake independently of insulin. The insulin-induced glucose uptake was enhanced by berberine in the absence of change in IRS-1 (Ser307/312), Akt, p70 S6, and ERK phosphorylation. AMPK phosphorylation was increased by berberine at 0.5 h, and the increase remained for > or =16 h. Aerobic and anaerobic respiration were determined to understand the mechanism of berberine action. The long-lasting phosphorylation of AMPK was associated with persistent elevation in AMP/ATP ratio and reduction in oxygen consumption. An increase in glycolysis was observed with a rise in lactic acid production. Berberine exhibited no cytotoxicity, and it protected plasma membrane in L6 myotubes in the cell culture. These results suggest that berberine enhances glucose metabolism by stimulation of glycolysis, which is related to inhibition of glucose oxidation in mitochondria. Berberine-induced AMPK activation is likely a consequence of mitochondria inhibition that increases the AMP/ATP ratio.


Figures

Fig. 1
Fig. 1
Berberine improved glucose metabolism in dietary obese rats. Twelve HFD fed rats were divided into control (n=6) and berberine-treated (n=6) groups. The treated rats were given berberine at 125 mg/Kg body weight twice a day by gastric gavage for 5 weeks. The control rats were gavaged with an equal volume of vehicle (distilled water). After 5-week treatment, intraperitoneal glucose tolerance test (IPGTT) was conducted after 10 hours fasting. A: Fasting blood glucose (FBG) and 2 hour postprandial blood glucose (PBG) determined during IPGTT in the rats. B: Fasting serum insulin levels in control and berberine-treated rats. C: HOMA-IR calculated by fasting serum insulin and FBG of the control and berberine treated rats.
Fig. 2
Fig. 2
Berberine (BER) increased glucose consumption in a dose-dependent manner. The cells were cultured in a 96-well plate. When experiments, the normal culture medium was replaced by serum-free DMEM supplemented with bovine serum albumin at 0.25%. Then, the cells were treated with berberine for 24 hours. Insulin was used in the positive control (INS; final concentration 100 nmol/L). A: Glucose consumption in 3T3-L1 adipocytes. B: Glucose consumption in C2C12 myotubes. C: Glucose consumption in L6 myotubes. D: Glucose consumption in H4IIE hepatocytes. Data was expressed as means ± SEM (n=8). Compared with control (0 μmol/L): *P<0.05, **P<0.01, ***P<0.001
Fig. 3
Fig. 3
Berberine (BER) increased 2-deoxy-glucose uptake in vitro. 3T3-L1 preadipocytes or L6 myoblasts were differentiated into mature adipocytes or myotubes in a 12-well plate. After serum-starvation in 0.25% BSA DMEM and berberine (2 μmol/L) treatment for 16 hours, the cells were treated with insulin (INS; final concentration 200 nmol/L) for 20 min at 37 C in PBS (1 ml/well). The glucose uptake was determined with 2-deoxy-3H-D-glucose or 3-O-[methyl-14C]-D-glucose. A: 2-deoxy-3H-D-glucose uptake in 3T3-L1 adipocytes. B: 2-deoxy-3H-D-glucose uptake in L6 myotubes. C: Time course of 2-deoxy-3H-D-glucose uptake was performed in 3T3-L1 adipocytes treated with 2 μmol/L berberine at different times. D: Time course of 2-deoxy-3H-D-glucose uptake was performed in L6 myotubes treated with 2 μmol/L berberine at different times. E. 3-O-[methyl-14C]-D-glucose (3-OMG) uptake in 3T3-L1 adipocytes. F: 3-O-[methyl-14C]-D-glucose uptake in L6 myotubes. Data was expressed as means ± SEM (n=3) of three experiments. Compared with control (0 μmol/L): **P<0.01, ***P<0.001
Fig. 4
Fig. 4
Effects of berberine on AMPK and insulin signaling pathway. Cells were treated with 2 μmol/L berberine for 16 hours after serum starvation in cell culture medium with 0.25% BSA. Twenty minutes prior to cell collection, insulin (200 nmol/L) was added to activate its signaling pathway. The whole cell lysate protein was examined in a western blot. Effects of berberine and insulin on AMPK and insulin signaling molecules were checked in 3T3-L1 adipocytes (A) and L6 myotubes (B). Similar results were obtained from triplicate experiments, and a representative experiment is shown. Ratio of pAMPK/AMPK was quantified in 3 independent experiments per condition (C). Data was expressed as means ± SEM (n=3). Compared with control (0 μmol/L): **P<0.01, ***P<0.001
Fig. 5
Fig. 5
Effects of berberine on phosphorylation of AMPK. A, B: 3T3-L1 adipocytes and L6 myotubes were treated with berberine for 16 hours after serum starvation in cell culture medium with 0.25% BSA. The whole cell lysate protein was examined in a western blot. C, D: The cells were treated with berberine for a variety of times after serum starvation in 0.25% BSA DMEM. Western blot was performed in the cells to check phosphorylation and total protein levels of AMPK. Similar results were obtained from triplicate experiments, and a representative experiment is shown. Ratio of pAMPK/AMPK was quantified in 3 independent experiments per condition. Data was expressed as means ± SEM (n=3). Compared with control (0 μmol/L): *P<0.05, **P<0.01
Fig. 6
Fig. 6
Berberine had no cytotoxicity. The cells were starved in serum-free DMEM supplemented with 0.25% BSA and treated with berberine for 24 hours. LDH concentrations in the medium and protein level of the cells were detected. A: Berberine treatment had no effects on the LDH release and protein level of 3T3-L1 adipocytes. B: Berberine decreased LDH release of L6 myotubes in a dose dependent manner. However, berberine had no effects on the protein level of L6 cells. Data was expressed as means ± SEM (n=3). Compared with control (0 μmol/L): *P<0.05, **P<0.01
Fig. 7
Fig. 7
Berberine (BER) decreased oxygen consumption in cells. The cells were plated into a plate in DMEM culture medium supplemented with 10% FBS. The plate was embedded with oxygen-sensitive dye. After 6 hours, berberine was added to the medium with or without insulin (INS; final concentration 100 nmol/L). Fluorescence was read after 12 hour treatment and normalized over the blank wells to obtain normalized relative fluorescence units (NRFU). A: Oxygen consumption in 3T3-L1 adipocytes. B: Oxygen consumption in L6 myotubes. C: Time course of oxygen consumption in 3T3-L1 adipocytes. A similar condition was used in time course experiments in the absence of insulin. Fluorescence was determined at different times after berberine (5 μmol/L) treatment. D: Time course of oxygen consumption in L6 myotubes. Data was expressed as means ± SEM (n=4). The comparison was made between berberine-treated and untreated cells: *P<0.05, **P<0.01, ***P<0.001, ****P<0.0001
Fig. 8
Fig. 8
Adenine nucleotide contents in cells. The cells were treated with 5 μmol/L berberine (BER) in serum-free medium for 16 hours. Then the cells were lyzed and examined for ATP and AMP levels by HPLC analysis. A: AMP/ATP in 3T3-L1 adipocytes. Berberine decreased ATP contents and increased AMP contents. The ratio of AMP/ATP was increased in 3T3-L1 adipocytes. B: ATP, AMP contents and AMP/ATP ratio were all increased by berberine in L6 myotubes. Data was expressed as means ± SEM (n=3). Statistical analysis was conducted by comparison of berberine and control groups.
Fig. 9
Fig. 9
Lactic acid production by cells. A, B: 3T3-L1 adipocytes and L6 myotubes were treated with berberine in the presence or absence of 100 nmo/L insulin (INS) for 24 hours in serum-free medium. Berberine (BER) treatment significantly increased release of lactic acid into the supernatant. C, D: For time course study, berberine treatment was conducted in serum-free medium, and berberine was added at 24h, 16h, 8h, 4h, 2h and 1h before the samples were collected for lactic acid assay. The point of “0” represents a value of untreated sample that was collected at the same time as the treated. The final concentration of berberine was 5 μmol/L. Data was expressed as means ± SEM (n=3). Compared with untreated cells (0 μmol/L): **P<0.01, ***P<0.001, ****P<0.0001

Similar articles

Cited by

References

    1. Barreto MC, Pinto RE, Arrabaca JD, Pavao ML. Inhibition of mouse liver respiration by Chelidonium majus isoquinoline alkaloids. Toxicol Lett. 2003;146:37–47. - PubMed
    1. Brusq JM, Ancellin N, Grondin P, Guillard R, Martin S, Saintillan Y, Issandou M. Inhibition of lipid synthesis through activation of AMP-kinase: An additional mechanism for the hypolipidemic effects of Berberine. J Lipid Res. 2006 - PubMed
    1. Cheng Z, Pang T, Gu M, Gao AH, Xie CM, Li JY, Nan FJ, Li J. Berberine-stimulated glucose uptake in L6 myotubes involves both AMPK and p38 MAPK. Biochim Biophys Acta. 2006;1760:1682–1689. - PubMed
    1. Faik P, Morgan M, Naftalin RJ, Rist RJ. Transport and accumulation of 2-deoxy-D-glucose in wild-type and hexokinase-deficient cultured Chinese-hamster ovary (CHO) cells. Biochem J. 1989;260:153–155. - PMC - PubMed
    1. Gao Z, Chiao P, Zhang X, Zhang X, Lazar MA, Seto E, Young HA, Ye J. Coactivators and corepressors of NF-kappaB in IkappaB alpha gene promoter. J Biol Chem. 2005;280:21091–21098. - PMC - PubMed

Publication types

MeSH terms