. 2007 Nov 28;26(23):4801-11.
doi: 10.1038/sj.emboj.7601909. Epub 2007 Nov 1.

A role for cytochrome c and cytochrome c peroxidase in electron shuttling from Erv1

Affiliations

A role for cytochrome c and cytochrome c peroxidase in electron shuttling from Erv1

Deepa V Dabir et al. EMBO J. .

Abstract

Erv1 is a flavin-dependent sulfhydryl oxidase in the mitochondrial intermembrane space (IMS) that functions in the import of cysteine-rich proteins. Redox titrations of recombinant Erv1 showed that it contains three distinct couples with midpoint potentials of -320, -215, and -150 mV. Like all redox-active enzymes, Erv1 requires one or more electron acceptors. We have generated strains with erv1 conditional alleles and employed biochemical and genetic strategies to facilitate identifying redox pathways involving Erv1. Here, we report that Erv1 forms a 1:1 complex with cytochrome c and a reduced Erv1 can transfer electrons directly to the ferric form of the cytochrome. Erv1 also utilized molecular oxygen as an electron acceptor to generate hydrogen peroxide, which is subsequently reduced to water by cytochrome c peroxidase (Ccp1). Oxidized Ccp1 was in turn reduced by the Erv1-reduced cytochrome c. By coupling these pathways, cytochrome c and Ccp1 function efficiently as Erv1-dependent electron acceptors. Thus, we propose that Erv1 utilizes diverse pathways for electron shuttling in the IMS.


Figures

Figure 1
Figure 1
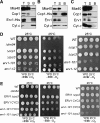
Steady-state levels of IMS proteins are reduced in mitochondria lacking functional Erv1. (A) Cells were grown to mid-log phase at 25°C and then serially diluted by a factor of 3 onto rich glucose (YPD) and ethanol-glycerol (YPEG) media before incubation at 25°C and 37°C. Strains included the parent (WT), tim9-3 mutant, and erv1 mutants harboring alleles erv1-101 and erv1-12. Plates were photographed after 3–4 days. (B) Steady-state levels of mitochondrial proteins (50 and 100 μg) were investigated by immunoblot analyses with antibodies against mitochondrial proteins indicated to the left. Mitochondria were purified from the parent (WT) and erv1-101 and erv1-12 strains grown either at the permissive temperature or shifted to the restrictive temperature of 37°C for 7 h.
Figure 2
Figure 2
Erv1 and cyt c form a complex in the IMS. (A) Mitochondria from a strain expressing a C-terminal histidine-tagged Erv1 (Erv1-His) were solubilized at 5 mg/ml in 1% digitonin. As a control, 100 μg of extract was withdrawn (T), and 500 μg lysate was incubated with Ni2+-agarose beads. The beads were washed, and bound proteins (B) were eluted with SDS–PAGE sample buffer. To assess the effectiveness of binding, 100 μg of the unbound protein fraction (S) was also included. Proteins were analyzed by immunoblotting with polyclonal antibodies against Mia40, Ccp1, Erv1, and cyt c. (B) Similar to (A), except that a C-terminal histidine-tagged Ccp1 was utilized. (C) The control reaction in which WT mitochondria have been treated identically. (D) Strains (WT, Δtim54, Δccp1, Δcyc3, and erv1 mutants, erv1-101 and erv1-12) were serially diluted on YPD medium in the presence and absence of ethidium bromide (EtBr) and incubated in aerobic (+O2) or anaerobic (−O2) conditions at 25°C. Plates were photographed after 3–5 days. Petite-negative Δtim54 was included as a control. (E) A cross between erv1-101 and Δccp1 that yielded tetratype segregation was analyzed for growth as described in (D).
Figure 3
Figure 3
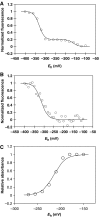
Oxidation–reduction titrations of Erv1 reveal three midpoint redox potentials. (A, B) Redox titrations of dithiol/disulfide couples in Erv1 were carried out using DTT or glutathione redox buffers. Redox equilibration was performed for 2 h at pH 7.0 with total redox buffer concentrations of 2.0 mM. Data in all titrations were fitted to the Nernst equation for a two-electron carrier. In (A), the titration was tested using the mBBr method. The best fit to the mBBr fluorescence magnitude versus Eh value was obtained for the presence of two separate (n=2) components, with Em values of −330 and −150 mV, respectively. In (B), the titration was performed using intrinsic tryptophan fluorescence to monitor the redox state of Erv1. The best fit to the data was for a single (n=2) component with Em=−315 mV. (C) The redox midpoint potential of the flavin group was determined by electrochemical titration of Erv1 (10.0 μM) at 10°C in 50 mM KPO4, pH 7.0, in the presence of 10 μM benzyl viologen, 10 μM anthraquinone-2-sulfonate, and 10 μM 2-hydroxy-1,4-napthoquinone as redox mediators. The difference in absorbance at 465 nm minus that at 550 nm was used to monitor the extent of FAD reduction. The value of this absorbance difference for the fully oxidized FAD was set as 1.0 and the value for the fully reduced FAD was set at 0.0, to define the relative absorbance difference scale. The open circles represent the measured relative absorbance and the solid line is the computer best fit of these data to the Nernst Equation for a two-electron redox couple with Em=−215 mV. Representative individual spectra taken at different defined Eh values are shown in Supplementary Figure 3.
Figure 4
Figure 4
Erv1 and cyt c form a 1:1 complex, in which Erv1 reduces cyt c directly. (A) A representative run showing the difference spectra resulting from complex formation between a 1:1 M ratio of Erv1 and cyt c. The solid line represents the spectrum arising from the complex under low ionic buffer (10 mM KPO4, pH 7.0); dashed line represents the spectrum from the complex in high ionic buffer (250 mM NaCl, pH 7.0). (B) Binding isotherms for complex formation at pH 7.0 between Erv1 and cyt c were monitored by changes in the UV/visible region of the absorbance spectrum. Increasing concentrations of cyt c as indicated were added to Erv1. The spectrum was not perturbed further when cyt c was added at an Erv1:cyt c molar ratio of greater than 1:1, suggesting a 1:1 complex. (C) The reduction of cyt c by Erv1 was measured at 550 nm as a function of time. The concentration of cyt c was fixed at 10 μM; Erv1 and DTT concentrations were 2.3 μM and 0.4 mM, respectively.
Figure 5
Figure 5
(A) A cross between erv1-101 and Δccp1 that yielded tetratype segregation was analyzed for growth as described in Figure 2D. (B) The erv1 mutants accrue elevated levels of H2O2. Yeast cells from the parental strain (WT) and erv1-101 and erv1-12 (grown in YPD to mid-log phase at 25°C or shifted to 37°C for 3 h) were incubated with DCFH-DA for 3 h. H2O2 production of samples incubated at 25°C (white bars) and 37°C (grey bars) was measured in arbitrary fluorescence units, which are presented as fold change with the WT at 25°C being set to ‘1'. n=3.
Figure 6
Figure 6
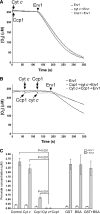
The Ccp1–cyt c couple competes with O2 for Erv1-mediated oxidation of DTT. (A) O2 consumption was measured in the O2 electrode (1 ml volume) after the addition of 2 μM Erv1 (denoted with arrowhead) to air-saturated buffer containing 2 mM DTT either in the presence of 20 μM cyt c (dashed line) or 20 μM Ccp1 (dotted line) or in the absence of both cyt c and Ccp1 (solid line). (B) As in (A), except that all three proteins were added successively in the following order (Ccp1 → cyt c → Erv1 depicted by the dashed line, cyt c → Ccp1 → Erv1 depicted by the dotted line, and Erv1 alone depicted by the solid line). O2 consumption was observed upon Erv1 addition. (C) As in (B), similar experiments were performed with 10 μM DTT, 1 μM Erv1, 1 μM Ccp1, and 1 μM cyt c, except that H2O2 concentration was measured after 30 min as described in the Supplementary data. Either cyt c or Ccp1 alone with DTT, and cyt c with Ccp1 and DTT were incubated in the absence (white bars) or presence of Erv1 (grey bars). To confirm specificity, non-related proteins BSA and GST were used as controls. Error bars indicate s.e.m. n=3.
Figure 7
Figure 7
Heme binding in cyt c and Ccp1 is impaired in the erv1 mutants. (A) Mitochondria were purified from the parental strain and erv1-12 strain grown at 25°C in the presence and absence of 20 μM hemin. Subsequently, mitochondria were incubated in 0.1% Triton-X buffer with the indicated concentration of proteinase K for 30 min on ice. Proteinase K was inactivated with 1 mM PMSF followed by acid-precipitation. Samples were separated by SDS–PAGE and immunoblotted with antibodies against Kdh, Ccp1, and cyt c. Kdh was used as a control for protease treatment. (B, C) The fraction of cyt c (B) and Ccp1 (C) resistant to protease was quantitated with a BioRad Versadoc and the affiliated Quantity 1 software *P<0.01 and #P<0.001 (n=3). (D) Mitochondria from the parental, Δccp1, ccp1H242P, erv1-101, and erv1-12 strains grown at either 25°C or 37°C were solubilized as in Figure 2A and separated on a 6–16% Colorless Native Polyacrylamide gel. Hemoproteins were visualized after TMBZ staining. In repetitive gels, the same samples were transferred to PVDF membranes for immunoblotting with antisera against Erv1, Ccp1, and cyt c. Arrows indicate bands recognized by all of the above antibodies and stained by TMBZ as well, whereas the arrowhead denoted by an asterisk marks a putative Erv1 complex in WT mitochondria.
Figure 8
Figure 8
Schematic illustrating potential redox pathways with Erv1, cyt c, and Ccp1. See text for details.

References

    1. Allen S, Balabanidou V, Sideris DP, Lisowsky T, Tokatlidis K (2005) Erv1 mediates the Mia40-dependent protein import pathway and provides a functional link to the respiratory chain by shuttling electrons to cytochrome c. J Mol Biol 353: 937–944 - PubMed
    1. Allen S, Lu H, Thornton D, Tokatlidis K (2003) Juxtaposition of the two distal ‘CX3C' motifs via intrachain disulfide bonding is essential for the folding of Tim10. J Biol Chem 278: 38505–38513 - PubMed
    1. Bader M, Muse W, Ballou DP, Gassner C, Bardwell JC (1999) Oxidative protein folding is driven by the electron transport system. Cell 98: 217–227 - PubMed
    1. Bosshard HR, Davidson MW, Knaff DB, Millett F (1986) Complex formation and electron transfer between mitochondrial cytochrome c and flavocytochrome c552 from Chromatium vinosum. J Biol Chem 261: 190–193 - PubMed
    1. Boveris A (1976) Mitochondrial production of hydrogen peroxide in Saccharomyces cerevisiae. Acta Physiol Lat Am 26: 303–309 - PubMed

Publication types

MeSH terms