Comparative Study
. 2007 Oct 31:8:91.
doi: 10.1186/1471-2202-8-91.

Fast reproducible identification and large-scale databasing of individual functional cognitive networks

Affiliations
Comparative Study

Fast reproducible identification and large-scale databasing of individual functional cognitive networks

Philippe Pinel et al. BMC Neurosci. .

Abstract

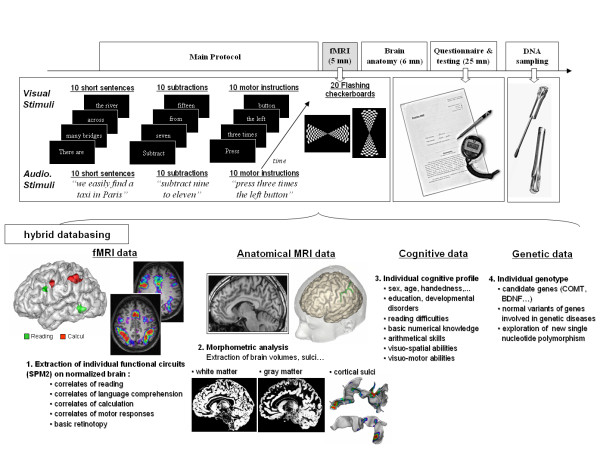
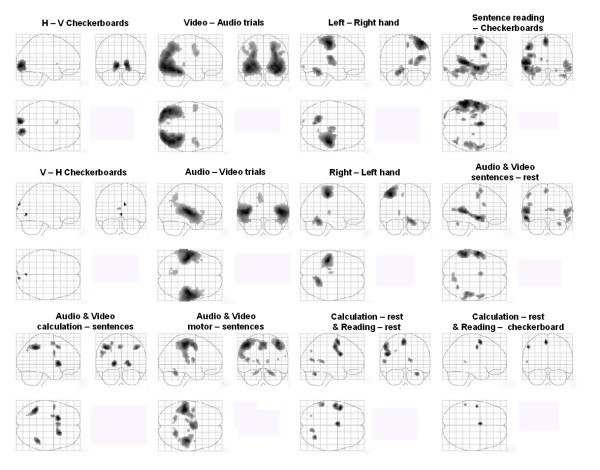
Background: Although cognitive processes such as reading and calculation are associated with reproducible cerebral networks, inter-individual variability is considerable. Understanding the origins of this variability will require the elaboration of large multimodal databases compiling behavioral, anatomical, genetic and functional neuroimaging data over hundreds of subjects. With this goal in mind, we designed a simple and fast acquisition procedure based on a 5-minute functional magnetic resonance imaging (fMRI) sequence that can be run as easily and as systematically as an anatomical scan, and is therefore used in every subject undergoing fMRI in our laboratory. This protocol captures the cerebral bases of auditory and visual perception, motor actions, reading, language comprehension and mental calculation at an individual level.

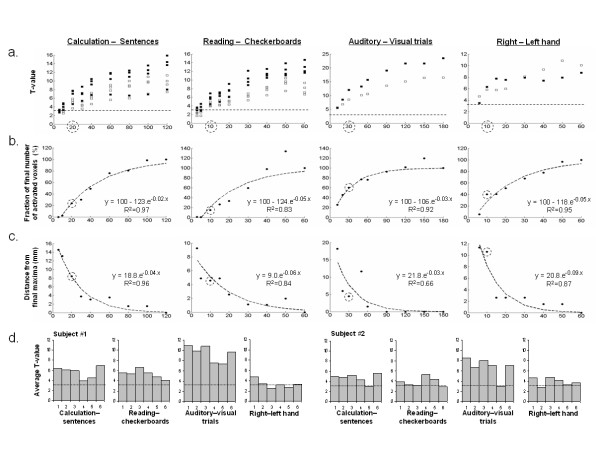
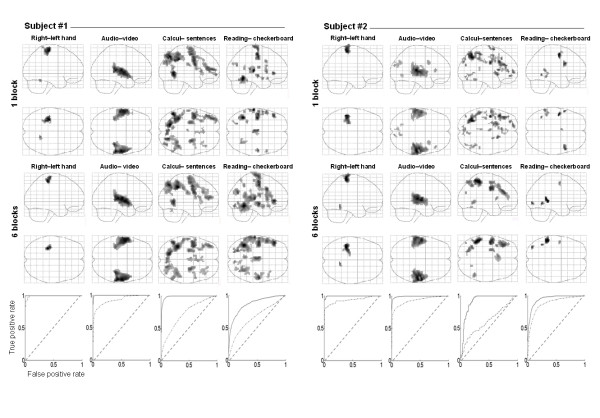
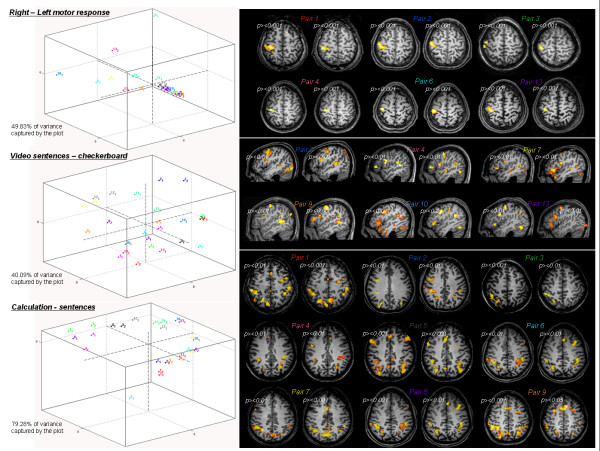
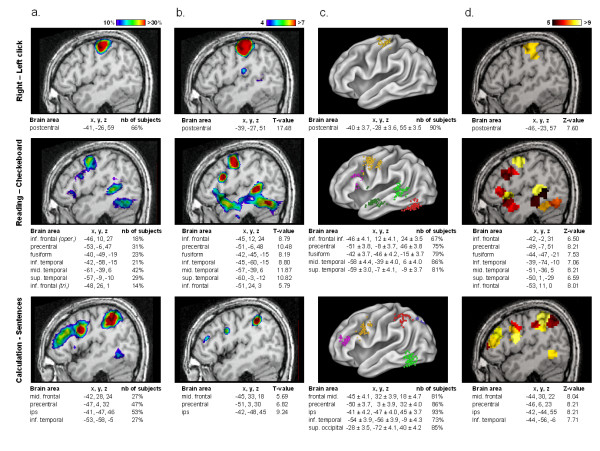
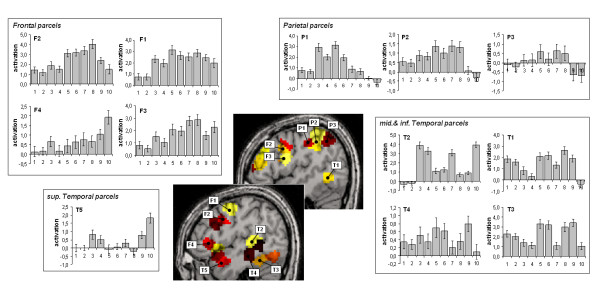
Results: 81 subjects were successfully scanned. Before describing inter-individual variability, we demonstrated in the present study the reliability of individual functional data obtained with this short protocol. Considering the anatomical variability, we then needed to correctly describe individual functional networks in a voxel-free space. We applied then non-voxel based methods that automatically extract main features of individual patterns of activation: group analyses performed on these individual data not only converge to those reported with a more conventional voxel-based random effect analysis, but also keep information concerning variance in location and degrees of activation across subjects.

Conclusion: This collection of individual fMRI data will help to describe the cerebral inter-subject variability of the correlates of some language, calculation and sensorimotor tasks. In association with demographic, anatomical, behavioral and genetic data, this protocol will serve as the cornerstone to establish a hybrid database of hundreds of subjects suitable to study the range and causes of variation in the cerebral bases of numerous mental processes.


Figures

Figure 1
Figure 1
Summary of data acquisition and databasing. The top row summarizes the chronology of the functional, anatomical, behavioral and genetic data acquisition. The middle row presents some examples of the tasks used in the fMRI protocol. The bottom row plots summaries of multimodal results which are available for each subject: functional networks related to each experimental condition, anatomical segmentation of grey/white matter and sulci extraction (two left intraparietal sulci are plotted with activation sites for reading and calculation), as well as various behavioral data allowing us to determine a rough cognitive profile of subjects and a genotyping of candidates genes. (Processing and 3D-rendering of brain anatomy were performed using Brainvisa ).
Figure 2
Figure 2
Impact of the trials number onto the description of individual functional maps. We plotted the evolution of several descriptors of cerebral activation with the number of trials acquired. A dotted circle indicates the value or number of trials obtained after 5 minutes of acquisition. a) Evolution of the t-value with the number of trials performed for 4 peaks selected for 4 contrasts plotted for 2 subjects (black square = subject 1, white square = subject 2). The dotted line represents the t-value corresponding to a voxel p value < 10-3). b) Number of activated voxels in the whole brain (p < 0.001 uncorrected, minimum cluster extent of 10 voxels) relative to the final number of voxels activated after 6 blocks (averaged over subjects). The dotted curve represents the fitted logarithmic curve. c) Evolution of the distance (mm) of selected peaks from their respective final location after 6 blocks (averaged over subjects). The dotted curve represents the fitted logarithmic curve. d) For each subject and each contrast the mean t-value of the 500 most significant voxels for each of the 6 blocks is plotted. The line represents t-value corresponding to a voxel p value < 10-3.
Figure 3
Figure 3
Individual functional information captured in 5 min. Illustration of functional information captured in one 5-minute session (one block) compared with a 30-minutes long session (6 blocks), for two subjects. Individual correlates of four tasks are plotted (sagital and axial view) at p < 10-3 uncorrected (cluster extent 10 voxels) for the one block analysis. Similar correlates are plotted at p < 10-3 corrected (cluster extent 10 voxel) for the six block analysis. Below are plotted ROC curves of each subject's contrast images. Solid line represent curve obtained using the t-value map of the corresponding subject, while dotted line represent curve obtained using the t-value map of the same contrast but of the other subject. Diagonal lines represent the ROC curves that would be obtained in the case of a non-informative random map.
Figure 4
Figure 4
Inter-subjects and inter-sessions within-subject variability. For three contrast, a MDS representation of inter-session distance is plotted (left side) in the 3D space which captured most of the variance. Different dot colors correspond to different subjects, and same color dots correspond to the different sessions performed by the same subject. On the right side, this variability is illustrated by individual statistical maps, projected on an axial slice for motor contrast (motor cortex), left sagital slice (covering superior temporal and middle frontal gyri) for reading and an axial slice for mental calculation (intra-parietal region). Each pair refers to two sessions of the same subject (session 1 plotted to the left of session 2) and colors correspond to the dot colors in the MDS graphs. Threshold level was adapted for each session (p < 10-2 or p < 10-3uncorrected at voxel level) to enhance topology similarity for pair sessions.
Figure 5
Figure 5
RFX group analysis. Contrast images of sensorimotor processes, word reading, native language encoding and mental calculation, shown on SPM glass-brains (sagital, coronal and axial view). Random effect analyses were performed on 81 subjects (p < 0.05 corrected for multiple comparison across brain volume, with a minimal cluster extent of 5 voxels).
Figure 6
Figure 6
Comparison and convergence of multiple group analyses. We compared voxel-based and non voxel-based group analyses for three contrasts and displayed results for the left hemisphere (one individual left sagital slice): right motor activation (first row), reading-related activation (second raw) and left calculation network (third raw). a) RFX map thresholded at Z > 4. b) Overlap of individual statistical maps thresholded each at p < 10-2 uncorrected. Color scale ranges from 10% to 30% overlap. c) Brain functional landmarks of the group, plotted on an inflated human template brain (with Caret software , Van Essen et al., 2001). Color code is used to mark all individual maxima corresponding to one functional area identified in the RFX analysis. Motor activation; yellow = central sulcus. Reading; yellow = precentral gyrus, purple = inf. frontal gyrus, light green = mid. temporal sulcus, dark green = sup. temporal sulcus, red = fusiform gyrus. Calculation; yellow = precentral gyrus, purple = mid. frontal gyrus, red = intraparietal sulcus, blue = sup. occipital gyrus, light green = inf. temporal gyrus. Number of subjects correspond to the number of BFLs with a p < 10-2. d) Parcel-based RFX map thresholded at Z > 5. Largest significances for each contrast are colored in yellow (coordinates of each cerebral area correspond to the centre of the most significantly activated local parcel). (abbreviation: ips = intraparietal sulcus, oper. = pars opercularis of inf. frontal cortex, tri. = pars triangularis of inf. frontal cortex).
Figure 7
Figure 7
Functional profiles of parcels. We detailed parcels of the left hemisphere for their significant activation (Z > 5) in the reading task (lower central sagital slice) and in the calculation task (upper slice). Histograms represent activation amplitude (%) across the ten tasks, averaged over subjects and plotted for 4 frontal, 3 parietal and 5 temporal parcels. Numerical code for the task is: 1 = horizontal checkerboard, 2 = vertical checkerboard, 3 = auditory right press command, 4 = auditory left press command, 5 = visual right press command, 6 = visual left press command, 7 = audio calculation, 8 = video calculation, 9 = video sentences, 10 = audio sentences.

Similar articles

Cited by

References

    1. Seghier ML, Lazeyras F, Pegna AJ, Annoni JM, Zimine I, Mayer E, Michel CM, Khateb A. Variability of fMRI activation during a phonological and semantic language task in healthy subjects. Hum Brain Mapp. 2004;23:140–155. doi: 10.1002/hbm.20053. - DOI - PMC - PubMed
    1. Mechelli A, Penny WD, Price CJ, Gitelman D, Friston KJ. Effective connectivity and intersubject variability: Using a multisubject network to test differences and commonalities. NeuroImage. 2002;17:1459–1469. doi: 10.1006/nimg.2002.1231. - DOI - PubMed
    1. Brett M, Johnsrude IS, Owen AM. The problem of functional localization in the human brain. Nat Rev Neurosci. 2002;3:243–249. doi: 10.1038/nrn756. - DOI - PubMed
    1. Friston KJ, Holmes AP, Worsley KJ. How many constitute a study? NeuroImage. 1999;10:1–5. doi: 10.1006/nimg.1999.0439. - DOI - PubMed
    1. Thirion B, Pinel P, Meriaux S, Roche A, Dehaene S, Poline JB. Analysis of a large fMRI cohort: Statistical and methodological issues for group analysis. NeuroImage. 2007;35:105–120. doi: 10.1016/j.neuroimage.2006.11.054. - DOI - PubMed

Publication types

LinkOut - more resources