. 2007 Oct 31:4:118.
doi: 10.1186/1743-422X-4-118.

Roles of adjuvant and route of vaccination in antibody response and protection engendered by a synthetic matrix protein 2-based influenza A virus vaccine in the mouse

Affiliations

Roles of adjuvant and route of vaccination in antibody response and protection engendered by a synthetic matrix protein 2-based influenza A virus vaccine in the mouse

Krystyna Mozdzanowska et al. Virol J. .

Abstract

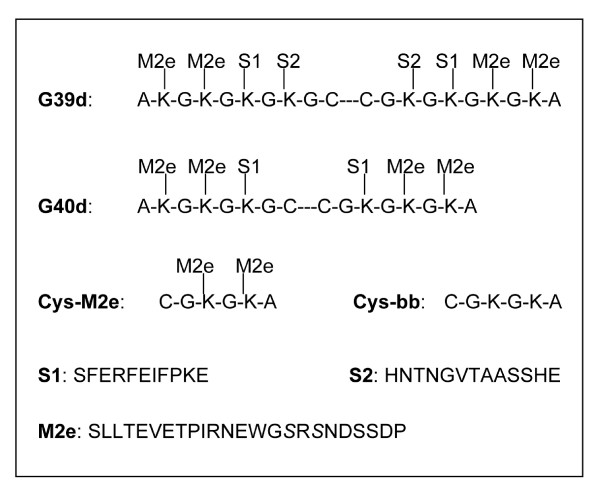
Background: The M2 ectodomain (M2e) of influenza A virus (IAV) strains that have circulated in humans during the past 90 years shows remarkably little structural diversity. Since M2e-specific antibodies (Abs) are capable of restricting IAV replication in vivo but are present only at minimal concentration in human sera, efforts are being made to develop a M2e-specific vaccine. We are exploring a synthetic multiple antigenic peptide (MAP) vaccine and here report on the role of adjuvants (cholera toxin and immunostimulatory oligodeoxynucleotide) and route of immunization on Ab response and strength of protection.

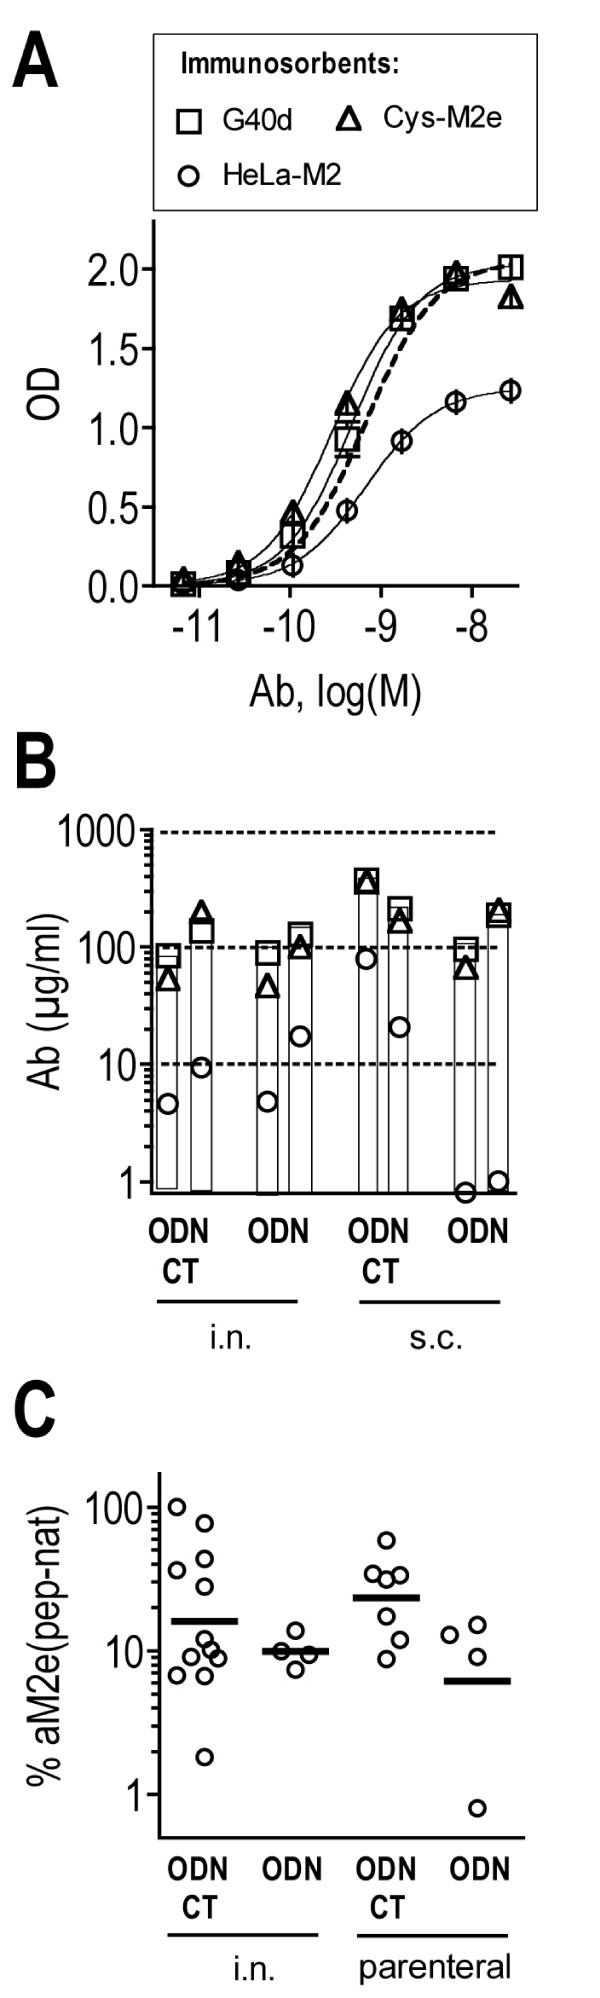
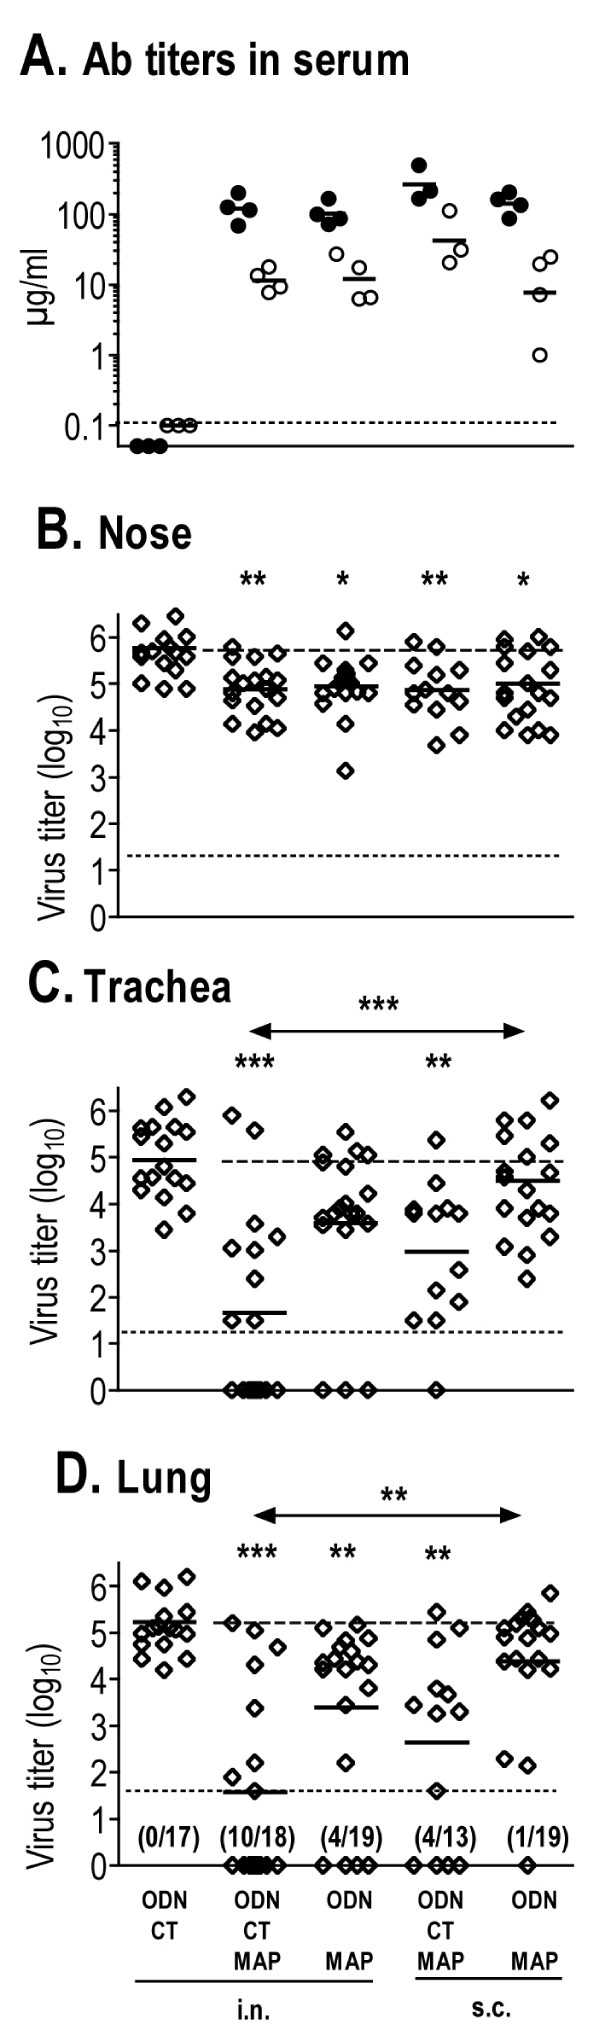
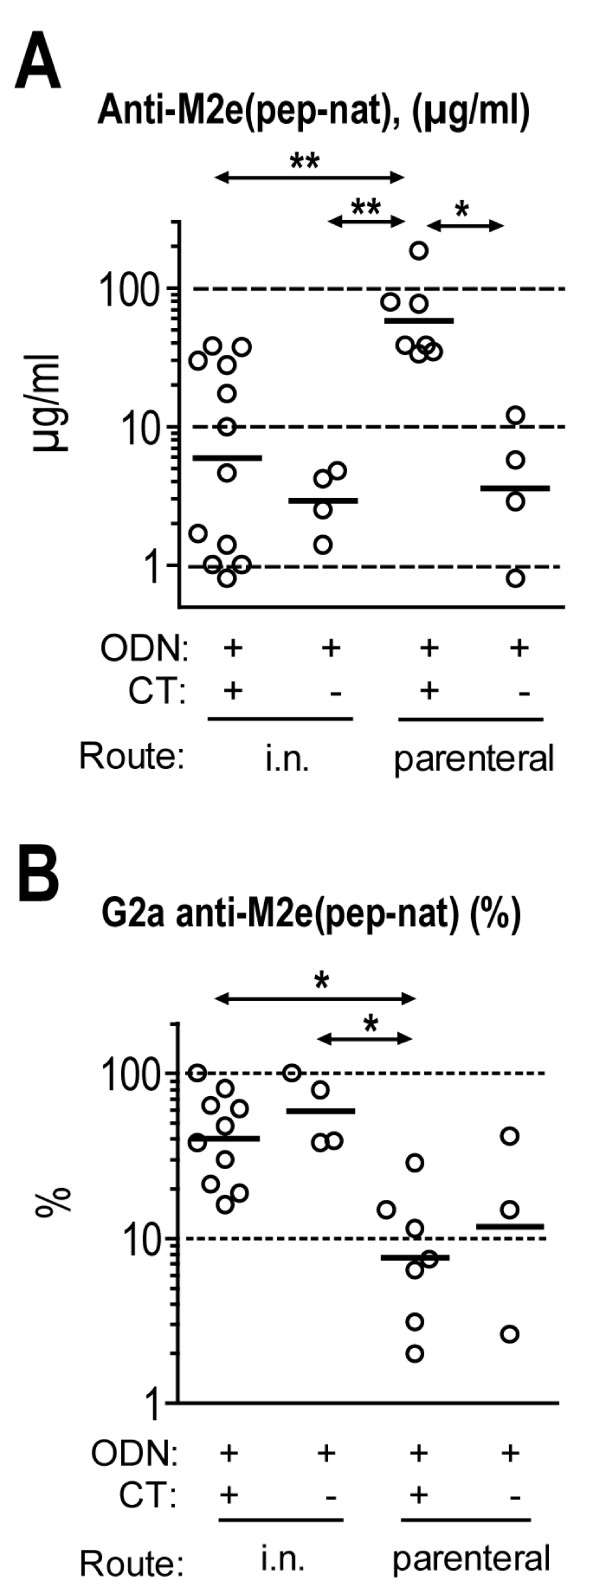
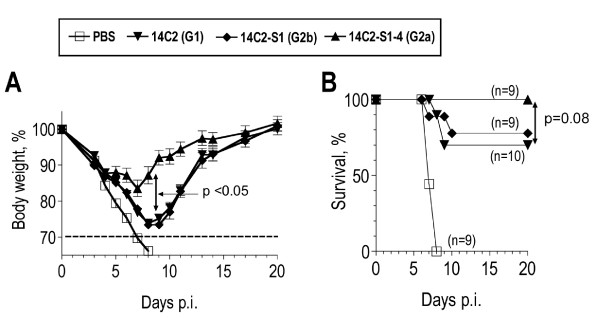
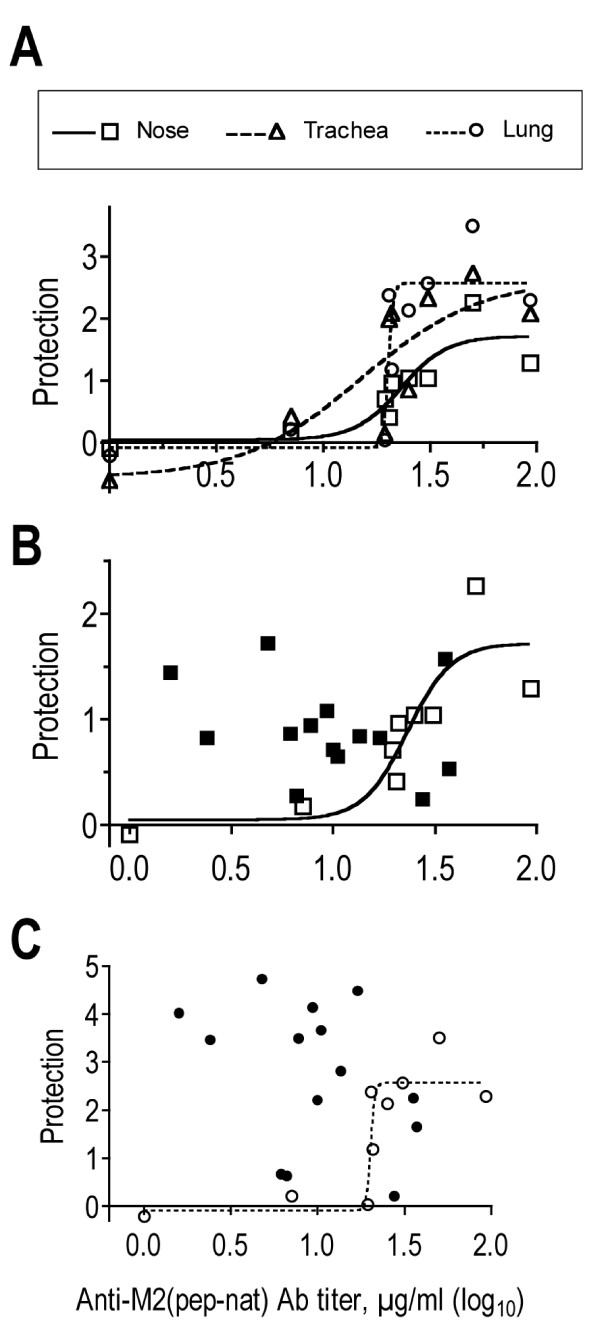
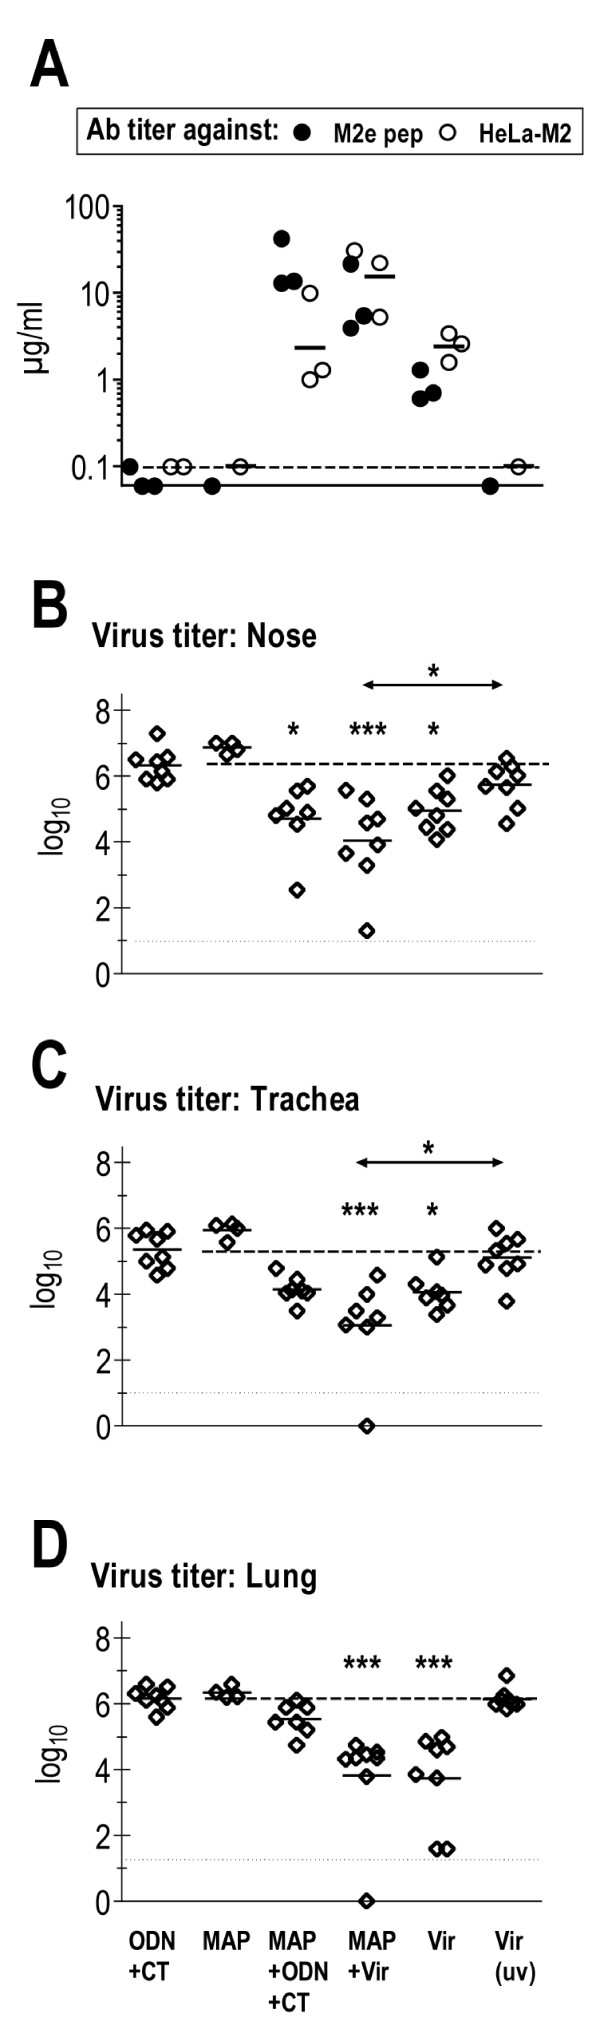
Results: Independent of adjuvants and immunization route, on average 87% of the M2e-MAP-induced Abs were specific for M2e peptide and a variable fraction of these M2e(pep)-specific Abs (average 15%) cross-reacted with presumably native M2e expressed by M2-transfected cells. The titer of these cross-reactive M2e(pep-nat)-specific Abs in sera of parenterally immunized mice displayed a sigmoidal relation to level of protection, with EC50 of approximately 20 microg Ab/ml serum, though experiments with passive M2e(pep-nat) Abs indicated that serum Abs did not fully account for protection in parenterally vaccinated mice, particularly in upper airways. Intranasal vaccination engendered stronger protection and a higher proportion of G2a Abs than parenteral vaccination, and the strength of protection failed to correlate with M2e(pep-nat)-specific serum Ab titers, suggesting a role of airway-associated immunity in protection of intranasally vaccinated mice. Intranasal administration of M2e-MAP without adjuvant engendered no response but coadministration with infectious IAV slightly enhanced the M2e(pep-nat) Ab response and protection compared to vaccination with IAV or adjuvanted M2e-MAP alone.

Conclusion: M2e-MAP is an effective immunogen as approximately 15% of the total M2e-MAP-induced Ab response is of desired specificity. While M2e(pep-nat)-specific serum Abs have an important role in restricting virus replication in trachea and lung, M2e-specific T cells and/or locally produced Abs contribute to protection in upper airways. Intranasal vaccination is preferable to parenteral vaccination, presumably because of induction of local protective immunity by the former route. Intranasal coadministration of M2e-MAP with infectious IAV merits further investigation in view of its potential applicability to human vaccination with live attenuated IAV.


Figures

Figure 1
Figure 1
Composition of MAPs. The amino acid (aa) composition of the scaffolds of G39d and G40d is shown in single letter code. The triple dash in the scaffolds denotes the disulfide bond between adjacent cysteins. S1 and S2 are helper T cell peptides and M2e the 24 N-terminal aa of M2, linked through their C-terminal aa to the indicated lysines of the scaffold peptides.
Figure 2
Figure 2
Fine specificity of the M2e-MAP induced Ab response. A. MAb 14C2-S1-4, which was used in all assays for quantification of serum Ab titers, was tested in ELISA against M2e-MAP Gd40 (squares), Cys-M2e (triangles) and HeLa-M2 (circles) as described in the method section, using the same reagents and incubation times for each assay. The mean OD (± SEM) above background of six replicates at each Ab dilution are shown. The three sigmoidal titration curves have similar EC50 values (-9.3 vs G40d, -9.5 vs Cys-M2e, -9.2 vs HeLa-M2). To further demonstrate the similarity between the three titration curves, OD values measured against HeLa-M2 were multiplied by 1.65 to generated the stipulated curve. A representative assay is shown. B. Pooled plasma samples (5 mice/group), obtained 3 wks after second (left column) and third (right column) immunization, were tested by ELISA for M2e-MAP- (squares), M2e(pep)- (triangles) and M2e(pep-nat)-specific (circles) Ab titers as described in the method section. The mice had been immunized with 3 μg M2e-MAP G40d and adjuvants by i.n. or s.c. routes as indicated below the x axis. Each symbol shows the mean serum Ab concentration determined in each sample by 2–3 independent assays. Data from a single vaccination experiment are shown. C. The fraction of M2e(pep-nat)-specific Abs is expressed as percent of the M2e(pep)-specific Ab concentration within each sample. Each dot indicates the % of anti-M2e(pep-nat) per group of 3–5 mice immunized by one of the protocols indicated below the x axis. In most groups, samples from secondary and tertiary responses were tested, and the mean % of these is shown. Horizontal bars indicate the geometric means within a vaccination protocol. Data from 12 independent vaccination experiments are shown. Groups immunized by different protocols did not differ significantly (ANOVA) with regards to percentage of anti-M2e(pep-nat)-specific Abs.
Figure 3
Figure 3
Ab response and protection after various modes of vaccination. A. BALB/c mice were vaccinated three times at 4–5 week intervals with 3 μg M2e-MAP (two experiments G39d, two G40d) and the indicated adjuvants (see bottom of figure) by i.n. or s.c. route. Mice were bled 3 weeks after the third immunization. Pooled plasma samples (3–5 mice/pool) were tested by ELISA for M2e(pep)- (dots) and M2e(pep-nat)-specific (circles) Ab titers. Horizontal bars indicate GMTs within each set. Data from four independent vaccination experiments are shown. B, C, D. 7–10 days after the third vaccination, mice were challenged by i.n. inoculation of 5 μl X31 (1000 TCID50/mouse). Five days later, nose, trachea and lung were tested for virus titer. Each symbol indicates the virus titer of an individual mouse. Horizontal bars indicate the GMT within each vaccination set. Dashed (top) and stipulated (bottom) horizontal lines indicate the mean virus titer of control mice and threshold of virus detection, respectively. Tissues with undetectable virus were assumed to be virus free. Data were analyzed by non-parametric ANOVA and Dunn's Multiple Comparison post test. M2e-MAP vaccination groups with statistically significant reduction in virus titer compared to the control group are indicated by asterisks right above the group and statistical differences between M2e-MAP vaccination groups by asterisks above two-sided arrows: p < 0.05 (*), p < 0.01 (**), p < 0.001 (***).
Figure 4
Figure 4
Effect of immunization protocol on size and G2a content of the M2e(pep-nat)-specific Ab response. A. M2e(pep-nat)-specific Ab titers in pooled plasma samples collected three weeks after second immunization from mice vaccinated with M2e-MAP according to the protocol indicated below the x axis. Each dot shows the titer of pooled plasma from 3–5 mice. Horizontal bars indicate the GMTs of groups within a given vaccination protocol. Data were analyzed by ANOVA and Tukey's Multiple Comparison post test. Statistically significant differences between group are indicated by asterisks above two-sided arrows: p < 0.05 (*), p < 0.01 (**). B. Pooled plasma from 4–5 mice/group collected three weeks after second and third immunization were tested for concentration of Cκ- (total) and γ 2a-expressing M2e(pep-nat)-specific Ab titers and the latter were expressed as percentage of the former. In groups that were immunized three times, the mean percentage of G2a after 2nd and 3rd immunization is shown. Groups with low M2e(pep-nat)-specific Ab titers that did not permit detection of G2a at ≤5% were excluded from the analysis. Horizontal bars show GMTs within distinct immunization protocols. Data were analyzed by ANOVA and Tukey's Multiple Comparison post test and marked as in A.
Figure 5
Figure 5
Role of heavy chain isotype in protection. Naive BALB/c mice were injected i.p. with 10 μg mAb 14C2 of G1 (triangles pointing down), G2b (diamonds) or G2a (triangles pointing up) isotype. The control group (open squares) received PBS i.p. One day later, mice were exposed to a total respiratory tract challenge with PR8 (4 LD50 in 50 μl) and monitored for weight loss. Pooled data from two independent experiments are shown, each performed with 4–5 mice/group. A. Symbols show mean % body weight and SEM (relative to day 0) of 9–10 mice/group. Differences between treatment groups were tested for statistical significance at individual days. Mice treated with G2a showed significantly (p < 0,05, ANOVA) less weight loss than those treated with G1 or G2b at days 6 to 13 p.i. B. Survival. Death was defined as >30% weight loss, at which stage mice were euthanized. Differences between survival curves were tested for statistical significance by log rank test.
Figure 6
Figure 6
Relation between M2e(pep-nat)-specific Ab titer and protection against virus challenge. Cκ-positive M2e(pep-nat)-specific Ab titers were determined in pooled plasma (3–5 mice/group) collected 7–10 days before challenge of mice by localized nasal infection (5 μl X31, 1000 TCID50). Five days after challenge, virus titers were determined in nose, trachea and lung of individual mice and the group average was determined. The average reduction in virus titer on log10 basis compared to the control group (immunized with adjuvant alone) was taken as measure of strength of protection (y axis). A. Protection in nose (squares), trachea (triangles) and lung (circles) from nine groups of mice immunized by parenteral route is plotted against the M2e(pep-nat)-specific serum Ab titer (x axis). Non-linear regression analysis yielded sigmoidal regression curves with R2 of 0.79 for nose (stipulated) and lung (continuous) and of 0.65 for trachea (dashed). B. Serum Ab titers and protection in nose observed in mice immunized by the i.n. route (filled squares) are plotted together with the regression line and corresponding data points (open squares) from mice immunized by parenteral route (as in A). C. Serum Ab titers and protection in lung of mice immunized by i.n. route (filled circles) are plotted together with the regression line and corresponding data points (open circles) from mice after parenteral immunization (as in A).
Figure 7
Figure 7
Immunization with the combination of infectious virus and M2e-MAP. BALB/c mice were immunized twice (4 week interval) by the i.n. route with the components listed at the bottom of the figure. Dosage/injection (50 μl): M2e-MAP G39d (3 μg), ODN (3 μg), CT (0.5 μg), Vir (150–200 TCID50 of PR8 for primary and of Seq14 for secondary immunization), Vir(uv) (5 μg of purified uv-inactivated PR8, <1 TCID50). Plasma was collected three weeks after second immunization and pooled within groups. A. Ab titer measured by ELISA against M2e peptide (closed circles) and HeLa-M2 (open circles) in pooled plasma samples of groups of 3–4 mice from three independent vaccination experiments. Bars indicate the GMTs. The stipulated horizontal line indicates the threshold of detection of Ab titers against HeLa-M2. B, C, D. Four weeks after the second immunization, mice from two vaccination experiments were challenged by i.n. inoculation of 50 μl X31, which initiates an infection throughout the entire respiratory tract. Virus titers in nose, trachea and lung were determined three days later. Each symbol indicates the total virus titer (TCID50) from an individual mouse in the nose (B), trachea (C) and lung (D). Bars indicate GMTs. The data were analyzed by non-parametric ANOVA and Dunn's Multiple Comparison Test. Statistical significance between experimental and control groups and between experimental groups is indicated by asterisks above each column and above two-sided arrows, respectively: p < 0.05 (*); p < 0.01 (**).

Similar articles

Cited by

References

    1. Smith NM, Bresee JS, Shay DK, Uyeki TM, Cox N, Strikas RA, Centers for Disease Control and Prevention (U.S.), Practices USACoI . Prevention and control of influenza : recommendations of the Advisory Committee on Immunization Practices (ACIP) Atlanta, GA: U.S. Dept. of Health & Human Services Centers for Disease Control and Prevention; 2006. - PubMed
    1. Simonsen L, Taylor RJ, Viboud C, Miller MA, Jackson LA. Mortality benefits of influenza vaccination in elderly people: an ongoing controversy. Lancet Infect Dis. 2007;7:658–666. doi: 10.1016/S1473-3099(07)70236-0. - DOI - PubMed
    1. Puck JM, Glezen WP, Frank AL, Six HR. Protection of infants from infection with influenza A virus by transplacentally acquired antibody. J Infect Dis. 1980;142:844–849. - PubMed
    1. Ernst WA, Kim HJ, Tumpey TM, Jansen AD, Tai W, Cramer DV, Adler-Moore JP, Fujii G. Protection against H1, H5, H6 and H9 influenza A infection with liposomal matrix 2 epitope vaccines. Vaccine. 2006;24:5158–5168. doi: 10.1016/j.vaccine.2006.04.008. - DOI - PubMed
    1. Fan J, Liang X, Horton MS, Perry HC, Citron MP, Heidecker GJ, Fu TM, Joyce J, Przysiecki CT, Keller PM, et al. Preclinical study of influenza virus A M2 peptide conjugate vaccines in mice, ferrets, and rhesus monkeys. Vaccine. 2004;22:2993–3003. doi: 10.1016/j.vaccine.2004.02.021. - DOI - PubMed

Publication types

MeSH terms