. 2007 Nov 1;21(21):2832-44.
doi: 10.1101/gad.1593307.

The TR2 and TR4 orphan nuclear receptors repress Gata1 transcription

Affiliations

The TR2 and TR4 orphan nuclear receptors repress Gata1 transcription

Osamu Tanabe et al. Genes Dev. .

Abstract

When the orphan nuclear receptors TR2 and TR4, the DNA-binding subunits of the DRED repressor complex, are forcibly expressed in erythroid cells of transgenic mice, embryos exhibit a transient mid-gestational anemia as a consequence of a reduction in the number of primitive erythroid cells. GATA-1 mRNA is specifically diminished in the erythroid cells of these TR2/TR4 transgenic embryos as it is in human CD34(+) progenitor cells transfected with forcibly expressed TR2/TR4. In contrast, in loss-of-function studies analyzing either Tr2- or Tr4-germline-null mutant mice or human CD34(+) progenitor cells transfected with force-expressed TR2 and TR4 short hairpin RNAs (shRNAs), GATA-1 mRNA is induced. An evolutionarily conserved direct repeat (DR) element, a canonical binding site for nuclear receptors, was identified in the GATA1 hematopoietic enhancer (G1HE), and TR2/TR4 binds to that site in vitro and in vivo. Mutation of that DR element led to elevated Gata1 promoter activity, and reduced promoter responsiveness to cotransfected TR2/TR4. Thus, TR2/TR4 directly represses Gata1/GATA1 transcription in murine and human erythroid progenitor cells through an evolutionarily conserved binding site within a well-characterized, tissue-specific Gata1 enhancer, thereby providing a mechanism by which Gata1 can be directly silenced during terminal erythroid maturation.


Figures

Figure 1.
Figure 1.
Transient embryonic anemia in TgTR4 and TgTR2/TR4 transgenic mice. The yolk sacs and embryos of 11.5-dpc TgTR4 (B,D) or their wild-type littermates (A,C) are shown. EryP colonies derived from the yolk sacs of wild-type (E) or TgTR2/TR4 (F) embryos are shown at the same magnification (see Materials and Methods). (G) Abundance of endogenous (open bars) or transgene-derived (shaded bars) TR2 and TR4 mRNAs in 11.5-dpc embryonic blood and 14.5-dpc fetal livers of the TgTR2/TR4 embryos or their wild-type littermates were determined by reverse transcription and real-time PCR, and were normalized to abundance of endogenous RNase inhibitor mRNA as the internal control (set at 100%). Data represent average with standard deviation of three to four embryos.
Figure 2.
Figure 2.
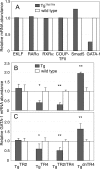
Transcription factor expression in TR2/TR4 transgenic mice. (A) Expression of EKLF, RXR, RAR, COUP-TFII, Smad5, and GATA-1 mRNAs in 11.5-dpc circulating blood of TgTR2/TR4 mice (shaded bars) was determined by semiquantitative RT–PCR. The PCR signals were quantified and normalized to coamplified GAPDH signals. The averages of the relative expression levels, normalized to that of wild-type littermates (set at 1.0 and represented by open bars), are graphically depicted. All experiments were repeated twice with essentially the same results; representative data from one experiment are shown. (B) The abundance of the GATA-1 mRNA in 11.5-dpc blood cells of the TgTR2, TgTR4, TgTR2/TR4, and TgdnTR4 mice (shaded bars) was quantified as in A. Data represent the averages ± SD of blood samples taken from five to six different embryos. (C) The abundance of the GATA-1 mRNA in 14.5-dpc fetal liver cells of TgTR2, TgTR4, TgTR2/TR4, and TgdnTR4 mice (shaded bars) was determined as in A. Three animals of each genotype were used in the analysis. (*) P < 0.05; (**) P < 0.01 by Student t-test.
Figure 3.
Figure 3.
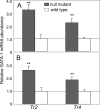
Expression of GATA-1 in Tr2- and Tr4-null mutant mice. The abundance of GATA-1 transcript in 11.5-dpc circulating blood cells (A) or in 14.5-dpc fetal liver cells (B) of Tr2- or Tr4-null mutant mice (shaded bars) was determined by duplex semiquantitative RT–PCR, using GAPDH mRNA as the internal control. Generation of the conditionally null mutant mice from which the null mutants were generated (O. Tanabe, unpubl.) will be described elsewhere. The relative expression of GATA-1 mRNA normalized to wild-type littermate controls (set at 1.0, open bars) is graphically depicted with SD indicated. Three animals of each genotype were analyzed. (**) P < 0.01.
Figure 4.
Figure 4.
Altering the abundance of TR2 and TR4 in human erythroid progenitor cells affects GATA1 transcription. (A) Flow cytometric analysis of in vitro differentiated human CD34+ cells. (B) Expression of human GATA1 gene transcription in in vitro differentiated human erythroblasts transfected with TR2 and/or TR4 expression vectors or TR2/TR4 shRNA vectors was determined by duplex semiquantitative RT–PCR using GAPDH as the internal control. The relative expression levels of GATA-1 mRNA normalized to empty-vector controls (set at 1.0) are shown. Data represent the averages ± SD of three independent experiments. (mTR2/TR4) Transfection to promote forced expression of mouse TR2 and TR4; (TR2 RNAi, TR4 RNAi) shRNA expression vectors designed to specifically target and degrade human TR2 or TR4 mRNAs, respectively; (RNAi + mTR2/TR4) CD34+ cells were transfected with shRNA expression vectors targeting human TR2 and TR4 together with plasmids that forcibly express mouse TR2 and TR4; (vector only) empty expression vectors and RNAi vectors. (C) TR2 and TR4 depletion in shRNA-transfected and in vitro differentiated human erythroblasts. The abundance of TR2 and TR4 mRNA was determined by semiquantitative RT–PCR using GAPDH as the internal control, and normalized to vector-only controls (set at 1.0, open bars). Data represent the averages ± SD of three independent experiments.
Figure 5.
Figure 5.
The evolutionarily conserved DR element in the G1HE binds TR2/TR4 in vitro and in vivo. (A) Schematic structure of the murine Gata1 gene. Exons are depicted as black rectangles. The positions of three DR elements that bind to TR2/TR4 in vitro are indicated by arrows. GATA sites are indicated by open boxes, and the G1HE is shown as a shaded rectangle. (B) The G1HE DR element is conserved between mouse and human. (C) Ten micrograms of pCMV expression vector driving Flag-tagged TR2 or TR4 cDNAs were transfected separately or together into 293T cells for nuclear extract preparation and EMSA (top panel), or Western blotting with anti-Flag, anti-TR2, or anti-TR4 antibody (bottom panels). 32P-labeled oligonucleotides corresponding to the mouse or human G1HE DR sequence or the mutated sequences were used as probes. DRs are indicated by arrows, while only mutated nucleotides are shown in the mutant. Anti-TR2 or anti-TR4 antibodies or preimmune serum (control) was included in binding reactions where indicated. The arrow indicates the position of TR2 or TR4 proteins bound to the probe. (D) EMSA competitive binding assay. Nuclear extract from 293T cells cotransfected with pCMV-FlagTR2 and pCMV-FlagTR4 were incubated with 1 nM 32P-labeled ε distal DR probe, and 1, 5, or 25 nM unlabeled competitor oligonucleotides. (E) TR2 and TR4 ChIP of the G1HE in in vitro differentiated human CD34+ cells. Purified CD34+ hematopoietic progenitor cells were examined for TR2 or TR4 binding after in vitro differentiation for 0, 8, or 11 d (see Materials and Methods) using ChIP assays, employing either anti-TR2 or anti-TR4 rabbit antibodies (Tanabe et al. 2007) or preimmune rabbit serum (control) to test for binding of the proteins to regulatory sequences around the GATA1 gene promoter. Immunoprecipitated DNA was quantified by real-time quantitative PCR using specific primers within the human GATA1 locus located at −7.7, −3.7, +1.5, or +3.5 kb relative to the exon IE transcription initiation site, and normalized to input DNA. The −3.7 kb site corresponds to the DR element located within the G1HE that binds avidly to TR2/TR4 (shown in D), and represents the only preferentially enriched sequence in these experiments. Data represent the averages with SD of three experiments. Triangles with solid lines indicate data with anti-TR2 antibody, inverted triangles with dashed lines indicate data with anti-TR4 antibody, and circles with dotted lines indicate data with preimmune serum. Filled symbols represent ChIP data after 0 d of CD34+ cell differentiation, while open symbols represent the same experiment performed on cells differentiated in vitro for 11 d (differentiation for 8 d gave identical results to the 0 d control) (data not shown).
Figure 6.
Figure 6.
G1HE DR mutation abrogates Gata1 transcriptional repression by TR2/TR4. (A) The wild-type or G1HE DR mutated IE3.9int Luc reporter (0.1 μg) was cotransfected with TR2, TR4, or RAR/RXR expression vectors (+, ++, and ++++ represent 0.4, 0.8, or 1.6 μg, respectively), or the TR2 and TR4 shRNA vectors into K562 cells. Firefly luciferase activities were normalized to cotransfected Renilla luciferase activities. Data represent the averages ± SD of three independent transfections. (B) Expression of Flag-tagged TR2 or TR4 in K562 cells after transfection with 9 or 18 μg of the pCMV/Flag/TR2 or pCMV/Flag/TR4 vector was examined by Western blotting with IRDye800-conjugated anti-Flag antibody. (C) Effect of RNAi on TR2 and TR4 expression in K562 cells. K562 cells (2 × 10⁵) were transfected with shRNA vectors (shaded bars) or control vector (open bars) along with a DsRed expression plasmid; DsRed-positive (transfected) cells were collected by flow cytometry. The recovered transfected cells were used for RNA preparation. The abundance of TR2 and TR4 mRNA was determined by semiquantitative RT–PCR using GAPDH as the internal control. Data represent the averages ± SD of three independent transfection experiments.

Similar articles

Cited by

References

    1. Anguita E., Hughes J., Heyworth C., Blobel G.A., Wood W.G., Higgs D.R., Hughes J., Heyworth C., Blobel G.A., Wood W.G., Higgs D.R., Heyworth C., Blobel G.A., Wood W.G., Higgs D.R., Blobel G.A., Wood W.G., Higgs D.R., Wood W.G., Higgs D.R., Higgs D.R. Globin gene activation during haemopoiesis is driven by protein complexes nucleated by GATA-1 and GATA-2. EMBO J. 2004;23:2841–2852. - PMC - PubMed
    1. Baines P., Mayani H., Bains M., Fisher J., Hoy T., Jacobs A., Mayani H., Bains M., Fisher J., Hoy T., Jacobs A., Bains M., Fisher J., Hoy T., Jacobs A., Fisher J., Hoy T., Jacobs A., Hoy T., Jacobs A., Jacobs A. Enrichment of CD34 (My10)-positive myeloid and erythroid progenitors from human marrow and their growth in cultures supplemented with recombinant human granulocyte-macrophage colony-stimulating factor. Exp. Hematol. 1988;16:785–789. - PubMed
    1. Chen Y.T., Collins L.L., Uno H., Chang C., Collins L.L., Uno H., Chang C., Uno H., Chang C., Chang C. Deficits in motor coordination with aberrant cerebellar development in mice lacking testicular orphan nuclear receptor 4. Mol. Cell. Biol. 2005;25:2722–2732. - PMC - PubMed
    1. Collins S.J. The role of retinoids and retinoic acid receptors in normal hematopoiesis. Leukemia. 2002;16:1896–1905. - PubMed
    1. Collins L.L., Lee Y.F., Heinlein C.A., Liu N.C., Chen Y.T., Shyr C.R., Meshul C.K., Uno H., Platt K.A., Chang C., Lee Y.F., Heinlein C.A., Liu N.C., Chen Y.T., Shyr C.R., Meshul C.K., Uno H., Platt K.A., Chang C., Heinlein C.A., Liu N.C., Chen Y.T., Shyr C.R., Meshul C.K., Uno H., Platt K.A., Chang C., Liu N.C., Chen Y.T., Shyr C.R., Meshul C.K., Uno H., Platt K.A., Chang C., Chen Y.T., Shyr C.R., Meshul C.K., Uno H., Platt K.A., Chang C., Shyr C.R., Meshul C.K., Uno H., Platt K.A., Chang C., Meshul C.K., Uno H., Platt K.A., Chang C., Uno H., Platt K.A., Chang C., Platt K.A., Chang C., Chang C. Growth retardation and abnormal maternal behavior in mice lacking testicular orphan nuclear receptor 4. Proc. Natl. Acad. Sci. 2004;101:15058–15063. - PMC - PubMed

Publication types

MeSH terms