

p53 signaling in response to increased DNA damage sensitizes AML1-ETO cells to stress-induced death
- PMID: 17975013
- PMCID: PMC2234055
- DOI: 10.1182/blood-2007-06-093682
p53 signaling in response to increased DNA damage sensitizes AML1-ETO cells to stress-induced death
Abstract
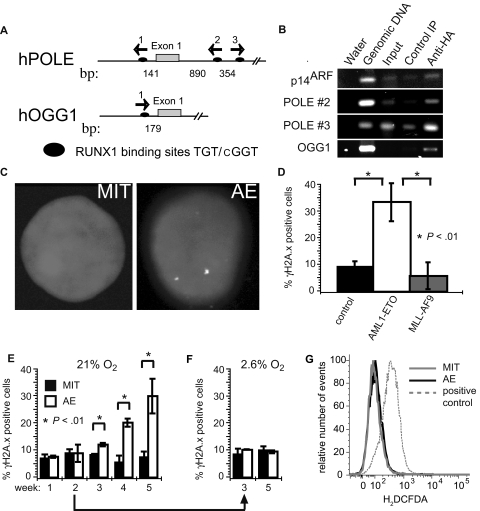
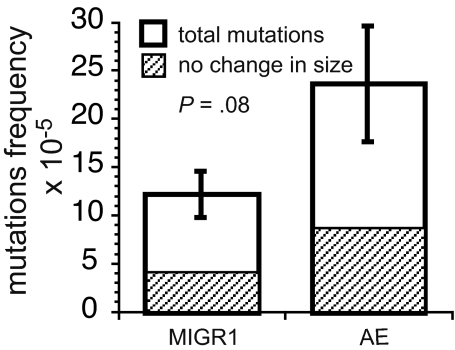
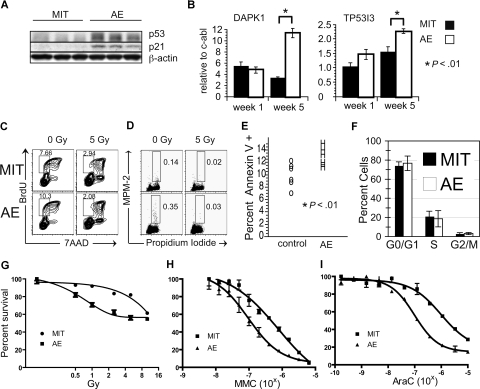
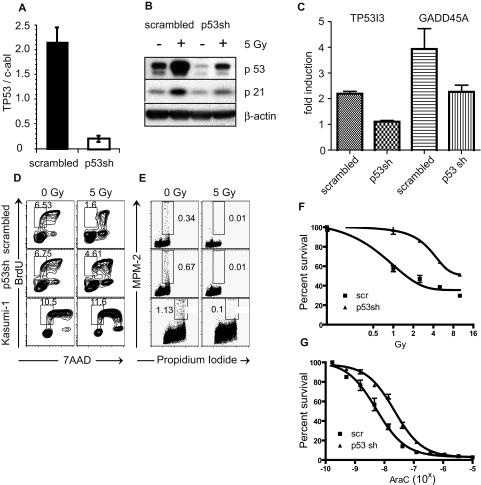
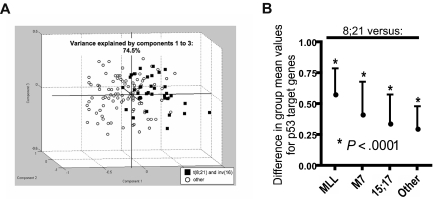
Chromosomal translocation (8;21) is present in 10% to 15% of patients with acute myeloid leukemia. Expression of the AML1-ETO (AE) fusion protein alone is not sufficient to induce leukemia, but the nature of the additional genetic alterations is unknown. It is unclear whether AE facilitates acquisition of these cooperating events. We show that AE down-regulates genes involved in multiple DNA repair pathways, potentially through a mechanism involving direct binding at promoter elements, and increases the mutation frequency in vivo. AE cells display increased DNA damage in vitro and have an activated p53 pathway. This results in increased basal apoptosis and enhanced sensitivity to DNA damaging agents. Intriguingly, microarray data indicate that t(8;21) patient samples exhibit decreased expression of DNA repair genes and increased expression of p53 response genes compared with other acute myeloid leukemia (AML) patient samples. Inhibition of the p53 pathway by RNAi increases the resistance of AE cells to DNA damage. We thus speculate that AML1-ETO may facilitate accumulation of genetic alterations by suppressing endogenous DNA repair. It is possible that the superior outcome of t(8;21) patients is partly due to an activated p53 pathway, and that loss of the p53 response pathway is associated with disease progression.
Figures
Similar articles
-
The thrombopoietin/MPL/Bcl-xL pathway is essential for survival and self-renewal in human preleukemia induced by AML1-ETO.Blood. 2012 Jul 26;120(4):709-19. doi: 10.1182/blood-2012-01-403212. Epub 2012 Feb 14. Blood. 2012. PMID: 22337712 Free PMC article.
-
AML1-ETO triggers epigenetic activation of early growth response gene l, inducing apoptosis in t(8;21) acute myeloid leukemia.FEBS J. 2014 Feb;281(4):1123-31. doi: 10.1111/febs.12673. Epub 2014 Jan 10. FEBS J. 2014. PMID: 24314118
-
UBASH3B/Sts-1-CBL axis regulates myeloid proliferation in human preleukemia induced by AML1-ETO.Leukemia. 2016 Mar;30(3):728-39. doi: 10.1038/leu.2015.275. Epub 2015 Oct 9. Leukemia. 2016. PMID: 26449661 Free PMC article.
-
RUNX1-ETO Leukemia.Adv Exp Med Biol. 2017;962:151-173. doi: 10.1007/978-981-10-3233-2_11. Adv Exp Med Biol. 2017. PMID: 28299657 Review.
-
AML1/ETO and its function as a regulator of gene transcription via epigenetic mechanisms.Oncogene. 2021 Sep;40(38):5665-5676. doi: 10.1038/s41388-021-01952-w. Epub 2021 Jul 30. Oncogene. 2021. PMID: 34331016 Free PMC article. Review.
Cited by
-
Contribution of an aged microenvironment to aging-associated myeloproliferative disease.PLoS One. 2012;7(2):e31523. doi: 10.1371/journal.pone.0031523. Epub 2012 Feb 21. PLoS One. 2012. PMID: 22363661 Free PMC article.
-
AML1-ETO mediates hematopoietic self-renewal and leukemogenesis through a COX/β-catenin signaling pathway.Blood. 2013 Jun 13;121(24):4906-16. doi: 10.1182/blood-2012-08-447763. Epub 2013 May 3. Blood. 2013. PMID: 23645839 Free PMC article.
-
Gene mutation profile and risk stratification in AML1‑ETO‑positive acute myeloid leukemia based on next‑generation sequencing.Oncol Rep. 2019 Dec;42(6):2333-2344. doi: 10.3892/or.2019.7375. Epub 2019 Oct 15. Oncol Rep. 2019. PMID: 31638252 Free PMC article.
-
Molecular pathogenesis of core binding factor leukemia: current knowledge and future prospects.Int J Hematol. 2011 Aug;94(2):126-133. doi: 10.1007/s12185-011-0858-z. Epub 2011 May 3. Int J Hematol. 2011. PMID: 21537931 Review.
-
Metabolomics study of the therapeutic mechanism of Schisandra chinensis lignans on aging rats induced by d-galactose.Clin Interv Aging. 2018 May 1;13:829-841. doi: 10.2147/CIA.S163275. eCollection 2018. Clin Interv Aging. 2018. PMID: 29750025 Free PMC article.
References
-
- Look AT. Oncogenic transcription factors in the human acute leukemias. Science. 1997;278:1059–1064. - PubMed
-
- Erickson P, Gao J, Chang KS, et al. Identification of breakpoints in t(8;21) acute myelogenous leukemia and isolation of a fusion transcript, AML1/ETO, with similarity to Drosophila segmentation gene, runt. Blood. 1992;80:1825–1831. - PubMed
-
- Licht JD. AML1 and the AML1-ETO fusion protein in the pathogenesis of t(8;21) AML. Oncogene. 2001;20:5660–5679. - PubMed
Publication types
MeSH terms
Substances
Grants and funding
LinkOut - more resources
Full Text Sources
Molecular Biology Databases
Research Materials
Miscellaneous
