

Pituitary-specific knockout of the Carney complex gene Prkar1a leads to pituitary tumorigenesis
- PMID: 17975024
- PMCID: PMC2234591
- DOI: 10.1210/me.2006-0428
Pituitary-specific knockout of the Carney complex gene Prkar1a leads to pituitary tumorigenesis
Abstract
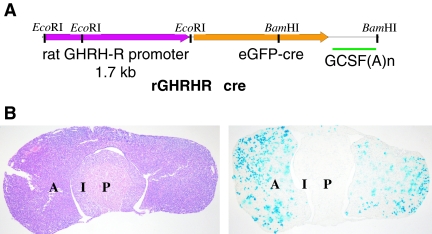
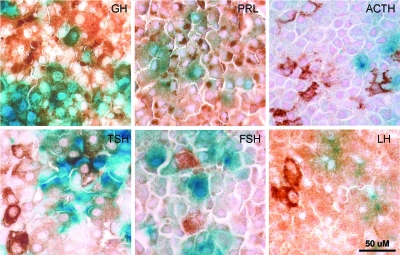
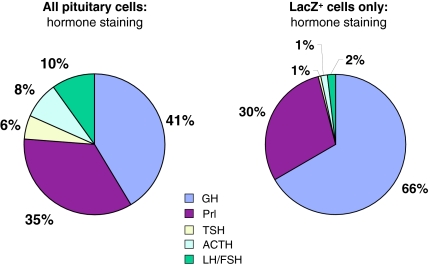
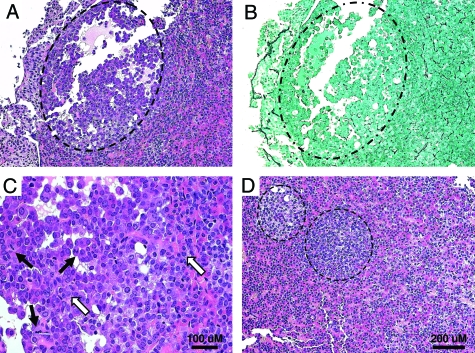
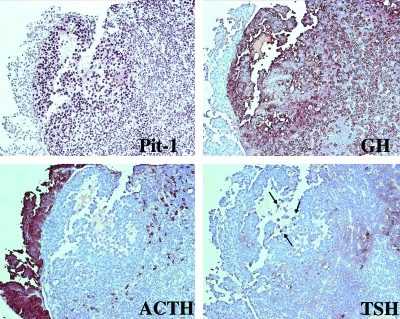
Carney complex (CNC) is an inherited neoplasia syndrome characterized by spotty skin pigmentation, myxomas, endocrine tumors, and schwannomas. Among the endocrine tumors that comprise the syndrome, GH-producing pituitary tumors are seen in approximately 10% of patients, although biochemical abnormalities of the GH axis are much more common. To explore the role of loss of the CNC gene PRKAR1A on pituitary tumorigenesis, we produced a tissue-specific knockout (KO) of this gene in the mouse. For these studies, we generated a mouse line expressing the cre recombinase in pituitary cells using the rat GHRH receptor promoter. These mice were then crossed with Prkar1a conditional null animals to produce tissue-specific KOs. Although prolactinomas were observed in KO and control mice, the KO mice exhibited a significantly increased frequency of pituitary tumors compared with wild-type or conventional Prkar1a(+/-) mice. Characterization of the tumors demonstrated they were composed of cells of the Pit1 lineage that stained for GH, prolactin, and TSH. At the biochemical level, levels of GH in the serum of KO animals were markedly elevated compared with controls, regardless of the presence of a frank tumor. These data indicate that complete loss of Prkar1a is sufficient to allow the formation of pituitary tumors and abnormalities of the GH axis, in close analogy to human patients with CNC.
Figures
Similar articles
-
PRKAR1A and the evolution of pituitary tumors.Mol Cell Endocrinol. 2010 Sep 15;326(1-2):3-7. doi: 10.1016/j.mce.2010.04.027. Epub 2010 May 6. Mol Cell Endocrinol. 2010. PMID: 20451576 Free PMC article. Review.
-
Pathology and molecular genetics of the pituitary gland in patients with the 'complex of spotty skin pigmentation, myxomas, endocrine overactivity and schwannomas' (Carney complex).Front Horm Res. 2004;32:253-64. doi: 10.1159/000079049. Front Horm Res. 2004. PMID: 15281351 Review.
-
Use of mouse models to understand the molecular basis of tissue-specific tumorigenesis in the Carney complex.J Intern Med. 2009 Jul;266(1):60-8. doi: 10.1111/j.1365-2796.2009.02114.x. J Intern Med. 2009. PMID: 19522826 Review.
-
Sequence analysis of the PRKAR1A gene in sporadic somatotroph and other pituitary tumours.Clin Endocrinol (Oxf). 2002 Oct;57(4):443-8. doi: 10.1046/j.1365-2265.2002.01643.x. Clin Endocrinol (Oxf). 2002. PMID: 12354125
-
Mutations of the gene encoding the protein kinase A type I-alpha regulatory subunit (PRKAR1A) in patients with the "complex of spotty skin pigmentation, myxomas, endocrine overactivity, and schwannomas" (Carney complex).Ann N Y Acad Sci. 2002 Jun;968:3-21. doi: 10.1111/j.1749-6632.2002.tb04323.x. Ann N Y Acad Sci. 2002. PMID: 12119264 Review.
Cited by
-
Phosphodiesterase 8B and cyclic AMP signaling in the adrenal cortex.Endocrine. 2015 Sep;50(1):27-31. doi: 10.1007/s12020-015-0621-y. Epub 2015 May 14. Endocrine. 2015. PMID: 25971952 Review.
-
Preclinical Models of Neuroendocrine Neoplasia.Cancers (Basel). 2022 Nov 17;14(22):5646. doi: 10.3390/cancers14225646. Cancers (Basel). 2022. PMID: 36428741 Free PMC article. Review.
-
Corticotropinoma as a Component of Carney Complex.J Endocr Soc. 2017 May 30;1(7):918-925. doi: 10.1210/js.2017-00231. eCollection 2017 Jul 1. J Endocr Soc. 2017. PMID: 29264542 Free PMC article.
-
A heritable predisposition to pituitary tumors.Pituitary. 2010 Jun;13(2):130-7. doi: 10.1007/s11102-009-0212-0. Pituitary. 2010. PMID: 20012699 Free PMC article.
-
Genetic predisposition to peripheral nerve neoplasia: diagnostic criteria and pathogenesis of neurofibromatoses, Carney complex, and related syndromes.Acta Neuropathol. 2012 Mar;123(3):349-67. doi: 10.1007/s00401-011-0935-7. Epub 2011 Dec 31. Acta Neuropathol. 2012. PMID: 22210082 Free PMC article. Review.
References
-
- Ezzat S, Asa SL, Couldwell WT, Barr CE, Dodge WE, Vance ML, McCutcheon IE 2004 The prevalence of pituitary adenomas: a systematic review. Cancer 101:613–619 - PubMed
-
- Brandi ML, Gagel RF, Angeli A, Bilezikian JP, Beck-Peccoz P, Bordi C, Conte-Devolx B, Falchetti A, Gheri RG, Libroia A, Lips CJ, Lombardi G, Mannelli M, Pacini F, Ponder BA, Raue F, Skogseid B, Tamburrano G, Thakker RV, Thompson NW, Tomassetti P, Tonelli F, Wells Jr SA, Marx SJ 2001 Guidelines for diagnosis and therapy of MEN type 1 and type 2. J Clin Endocrinol Metab 86:5658–5671 - PubMed
-
- Stratakis CA, Kirschner LS, Carney JA 2001 Clinical and molecular features of the Carney complex: diagnostic criteria and recommendations for patient evaluation. J Clin Endocrinol Metab 86:4041–4046 - PubMed
-
- Pack SD, Kirschner LS, Pak E, Zhuang Z, Carney JA, Stratakis CA 2000 Genetic and histologic studies of somatomammotropic pituitary tumors in patients with the “complex of spotty skin pigmentation, myxomas, endocrine overactivity and schwannomas” (Carney complex). J Clin Endocrinol Metab 85:3860–3865 - PubMed
Publication types
MeSH terms
Substances
Grants and funding
LinkOut - more resources
Full Text Sources
Medical
Molecular Biology Databases
Research Materials
