

Characterization of transplanted green fluorescent protein+ bone marrow cells into adipose tissue
- PMID: 17975222
- PMCID: PMC2268622
- DOI: 10.1634/stemcells.2007-0567
Characterization of transplanted green fluorescent protein+ bone marrow cells into adipose tissue
Abstract
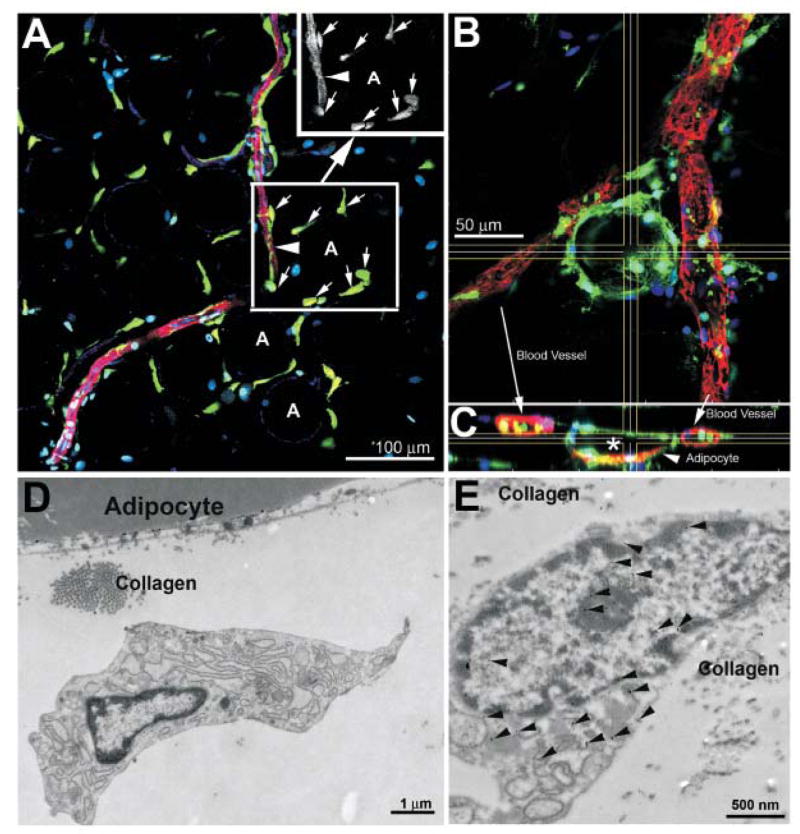
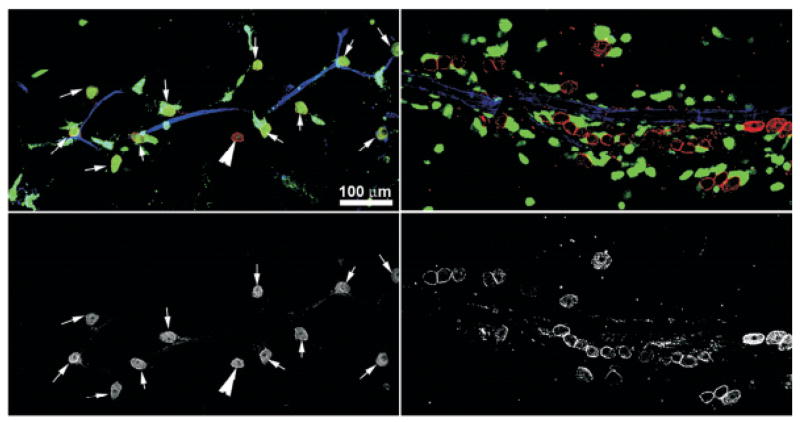
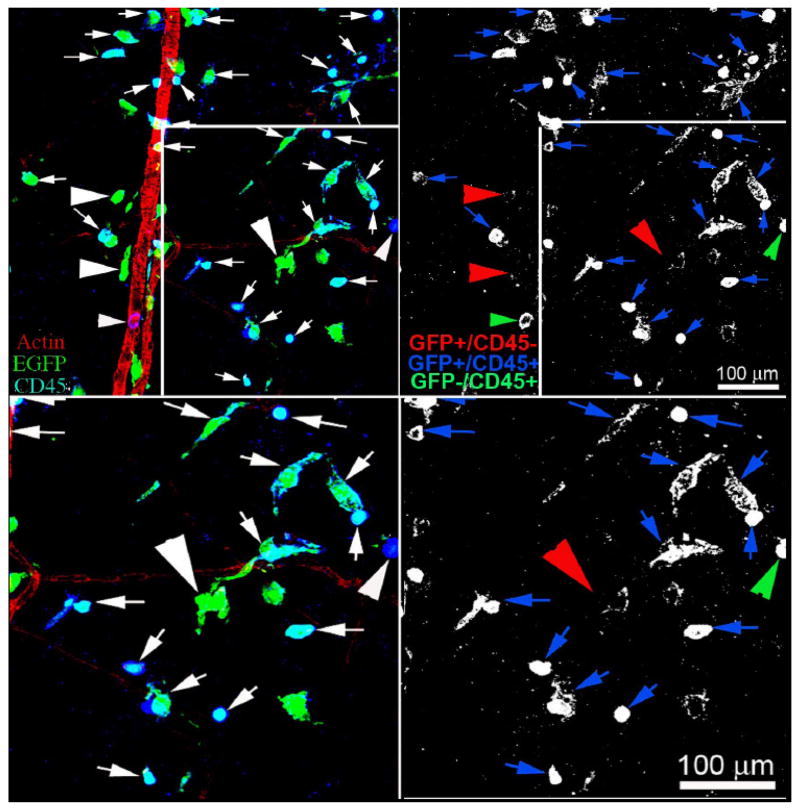
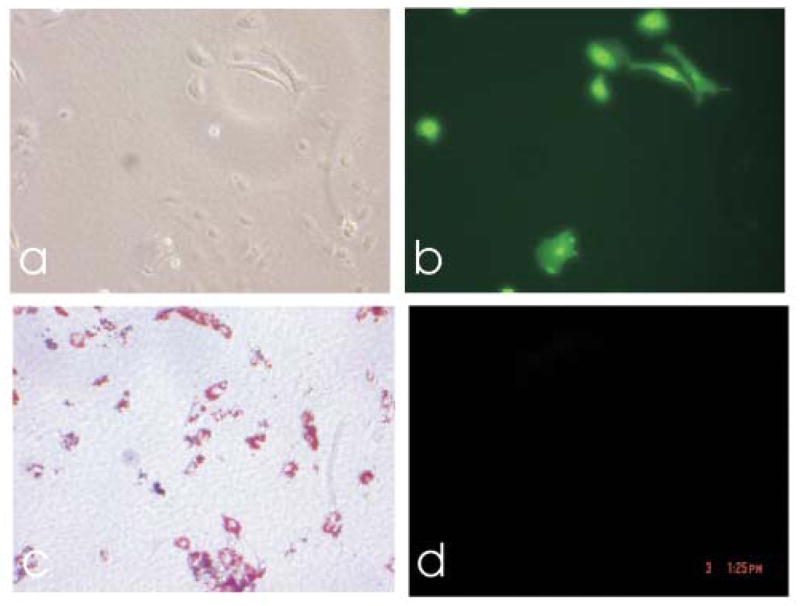
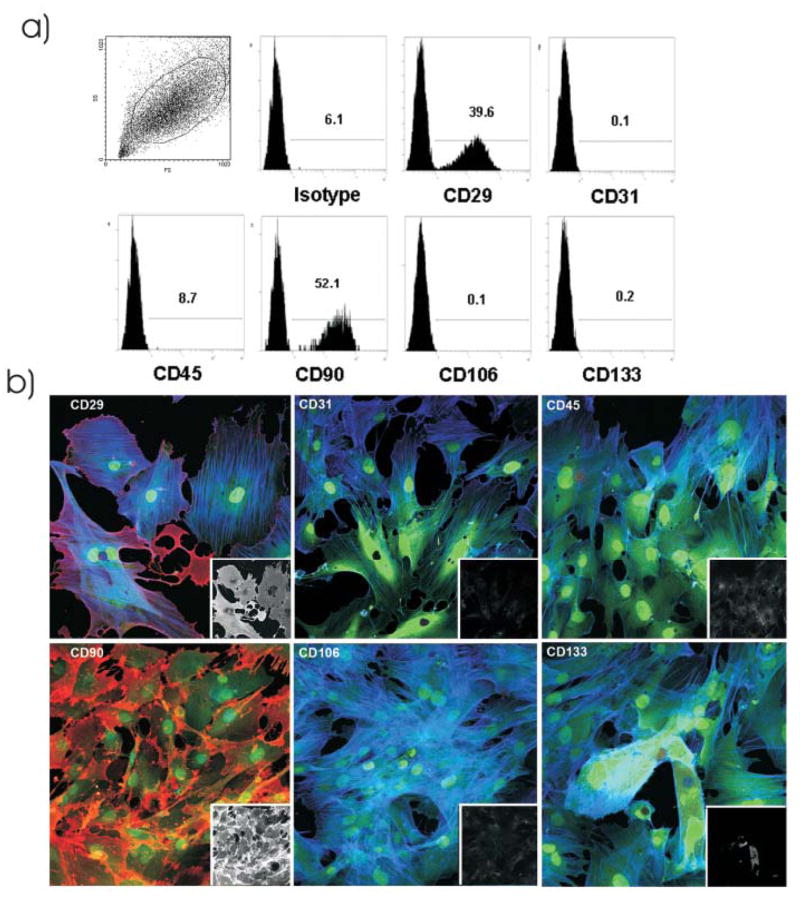
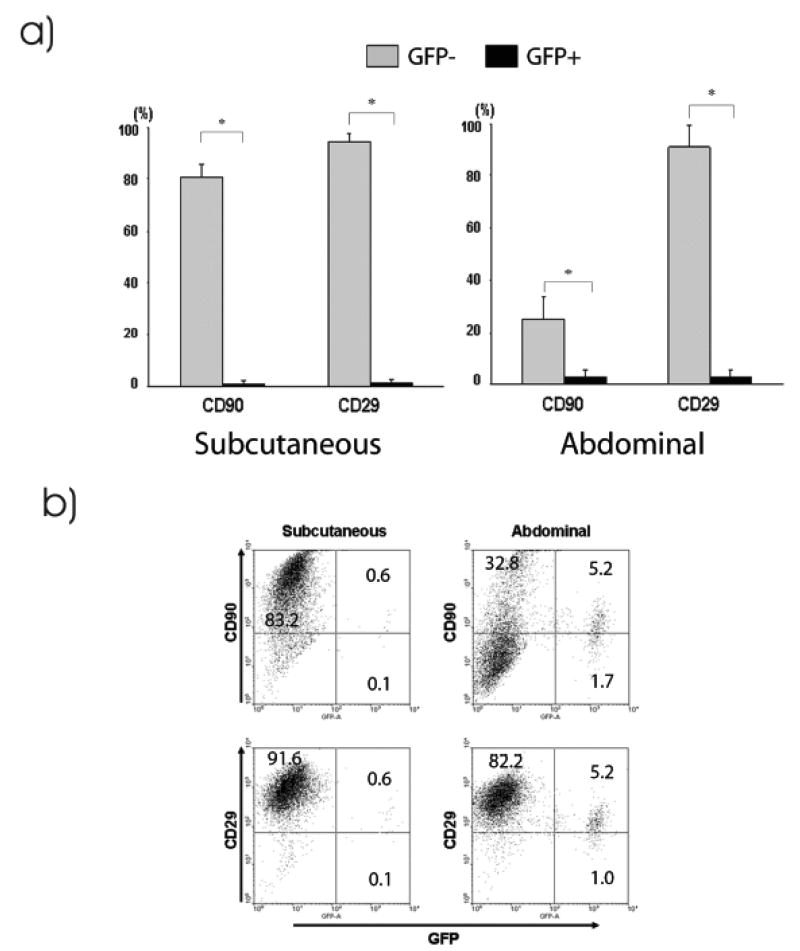
Following transplantation of green fluorescent protein (GFP)-labeled bone marrow (BM) into irradiated, wild-type Sprague-Dawley rats, propagated GFP(+) cells migrate to adipose tissue compartments. To determine the relationship between GFP(+) BM-derived cells and tissue-resident GFP(-) cells on the stem cell population of adipose tissue, we conducted detailed immunohistochemical analysis of chimeric whole fat compartments and subsequently isolated and characterized adipose-derived stem cells (ASCs) from GFP(+) BM chimeras. In immunohistochemistry, a large fraction of GFP(+) cells in adipose tissue were strongly positive for CD45 and smooth muscle actin and were evenly scattered around the adipocytes and blood vessels, whereas all CD45(+) cells within the blood vessels were GFP(+). A small fraction of GFP(+) cells with the mesenchymal marker CD90 also existed in the perivascular area. Flow cytometric and immunocytochemical analyses showed that cultured ASCs were CD45(-)/CD90(+)/CD29(+). There was a significant difference in both the cell number and phenotype of the GFP(+) ASCs in two different adipose compartments, the omental (abdominal) and the inguinal (subcutaneous) fat pads; a significantly higher number of GFP(-)/CD90(+) cells were isolated from the subcutaneous depot as compared with the abdominal depot. The in vitro adipogenic differentiation of the ASCs was achieved; however, all cells that had differentiated were GFP(-). Based on phenotypical analysis, GFP(+) cells in adipose tissue in this rat model appear to be of both hematopoietic and mesenchymal origin; however, infrequent isolation of GFP(+) ASCs and their lack of adipogenic differentiation suggest that the contribution of BM to ASC generation might be minor.
Figures
Similar articles
-
Isolation and adipogenic differentiation of murine mesenchymal stem cells harvested from macrophage-depleted bone marrow and adipose tissue.Adipocyte. 2024 Dec;13(1):2350751. doi: 10.1080/21623945.2024.2350751. Epub 2024 Jun 11. Adipocyte. 2024. PMID: 38860452 Free PMC article.
-
Adipose tissue-derived stem cells for cell therapy of airway allergic diseases in mouse.Acta Histochem. 2011 Sep;113(5):501-7. doi: 10.1016/j.acthis.2010.05.003. Epub 2010 Jul 2. Acta Histochem. 2011. PMID: 20598357
-
The efficiency of in vitro isolation and myogenic differentiation of MSCs derived from adipose connective tissue, bone marrow, and skeletal muscle tissue.In Vitro Cell Dev Biol Anim. 2012 Apr;48(4):203-15. doi: 10.1007/s11626-012-9488-x. Epub 2012 Mar 7. In Vitro Cell Dev Biol Anim. 2012. PMID: 22396125
-
Same or not the same? Comparison of adipose tissue-derived versus bone marrow-derived mesenchymal stem and stromal cells.Stem Cells Dev. 2012 Sep 20;21(14):2724-52. doi: 10.1089/scd.2011.0722. Epub 2012 May 9. Stem Cells Dev. 2012. PMID: 22468918 Review.
-
Adipose-derived stromal cells in regulation of hematopoiesis.Cell Mol Biol Lett. 2020 Mar 5;25:16. doi: 10.1186/s11658-020-00209-w. eCollection 2020. Cell Mol Biol Lett. 2020. PMID: 32161623 Free PMC article. Review.
Cited by
-
Influence of BMI on level of circulating progenitor cells.Obesity (Silver Spring). 2011 Aug;19(8):1722-6. doi: 10.1038/oby.2010.347. Epub 2011 Feb 3. Obesity (Silver Spring). 2011. PMID: 21293449 Free PMC article.
-
Hematopoietic Stem Cell-derived Adipocytes Promote Tumor Growth and Cancer Cell Migration.Int J Cancer Res Mol Mech. 2017;3(1):10.16966/2381-3318.130. doi: 10.16966/2381-3318.130. Epub 2017 Mar 8. Int J Cancer Res Mol Mech. 2017. PMID: 28989976 Free PMC article.
-
The vascular endothelium of the adipose tissue gives rise to both white and brown fat cells.Cell Metab. 2012 Feb 8;15(2):222-9. doi: 10.1016/j.cmet.2012.01.008. Cell Metab. 2012. PMID: 22326223 Free PMC article.
-
De novo generation of white adipocytes from the myeloid lineage via mesenchymal intermediates is age, adipose depot, and gender specific.Proc Natl Acad Sci U S A. 2010 Aug 17;107(33):14781-6. doi: 10.1073/pnas.1003512107. Epub 2010 Aug 2. Proc Natl Acad Sci U S A. 2010. PMID: 20679227 Free PMC article.
-
Altered adipose tissue and adipocyte function in the pathogenesis of metabolic syndrome.J Clin Invest. 2019 Oct 1;129(10):3990-4000. doi: 10.1172/JCI129187. J Clin Invest. 2019. PMID: 31573548 Free PMC article. Review.
References
-
- Stiles J, Francendese A, Masoro E. Influence of age on size and number of fat cells in the epididymal depot. Am J Physiol. 1975;229:1531–1568. - PubMed
-
- Dardick I, Poznanski W, Waheed I, et al. Ultrastructural observations on differentiating human preadipocytes cultured in vitro. Tissue Cell. 1976;8:561–571. - PubMed
-
- Hausman GJ, Richardson RL. Newly recruited and pre-existing preadipocytes in cultures of porcine stromal-vascular cells: morphology, expression of extracellular matrix components, and lipid accretion. J Anim Sci. 1998;76:48–60. - PubMed
-
- Niesler CU, Siddle K, Prins JB. Human preadipocytes display a depot-specific susceptibility to apoptosis. Diabetes. 1998;47:1365–1368. - PubMed
-
- Maslowska MHSA, MacLean LD, Cianflone K. Regional differences in triacylglycerol synthesis in adipose tissue and in cultured preadipocytes. Journal of Lipid Research. 1993;34:219–228. - PubMed
Publication types
MeSH terms
Substances
Grants and funding
LinkOut - more resources
Full Text Sources
Medical
Research Materials
Miscellaneous
