. 2007 Nov 27;46(47):13593-605.
doi: 10.1021/bi701649b. Epub 2007 Nov 2.

Detection and characterization of two ATP-dependent conformational changes in proteolytically inactive Escherichia coli Lon mutants by stopped flow kinetic techniques

Affiliations

Detection and characterization of two ATP-dependent conformational changes in proteolytically inactive Escherichia coli Lon mutants by stopped flow kinetic techniques

Jessica Patterson-Ward et al. Biochemistry. .

Abstract

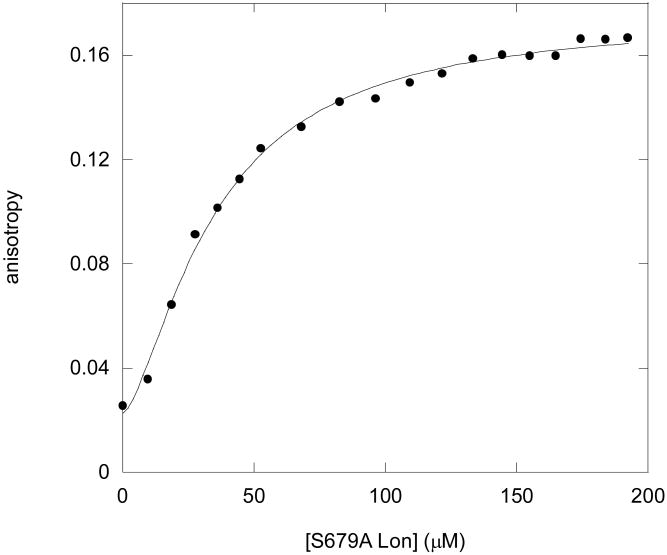
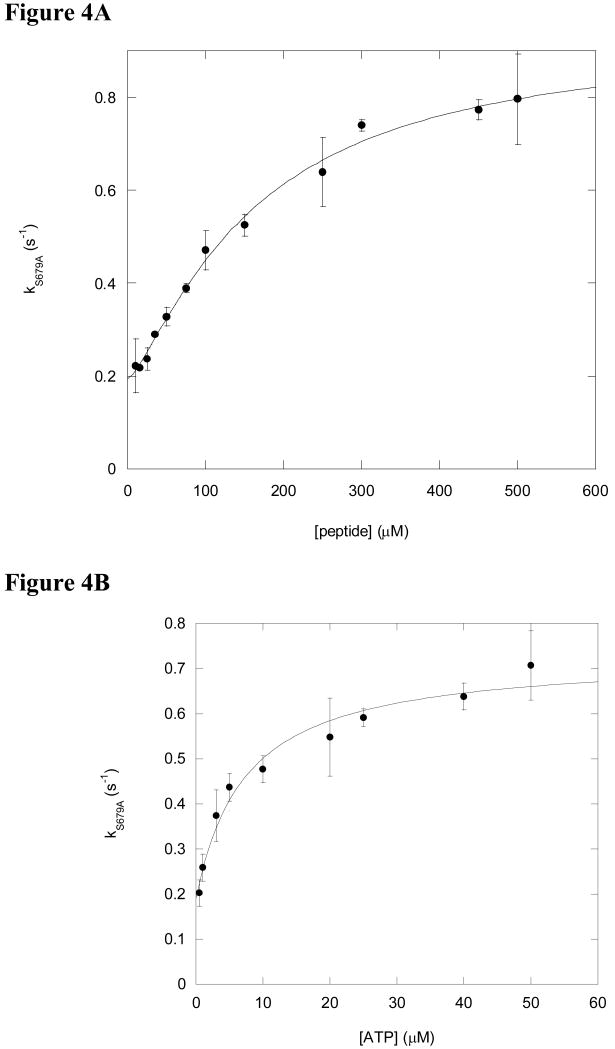
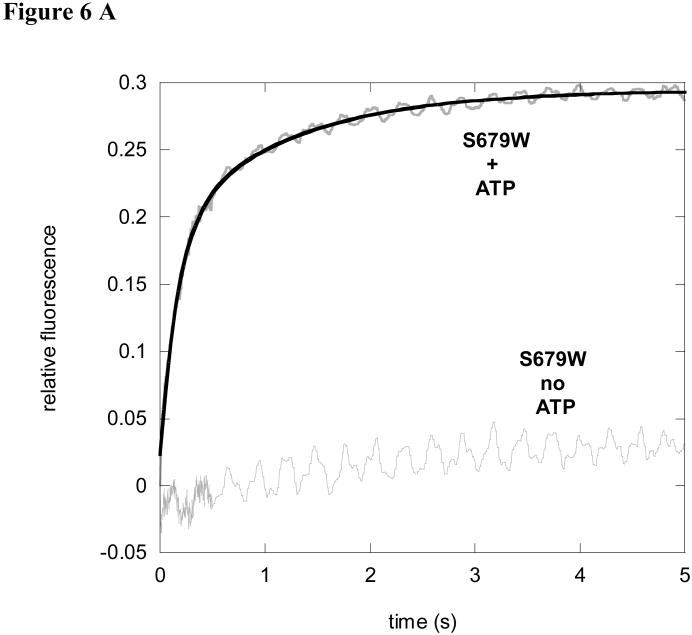
Lon is an ATP dependent serine protease responsible for degrading denatured, oxidatively damaged and certain regulatory proteins in the cell. In this study we exploited the fluorescence properties of a dansylated peptide substrate (S4) and the intrinsic Trp residues in Lon to monitor peptide interacting with the enzyme. We generated two proteolytically inactive Lon mutants, S679A and S679W, where the active site serine is mutated to an Ala and Trp residue, respectively. Stopped-flow fluorescence spectroscopy was used to identify key enzyme intermediates generated along the reaction pathway prior to peptide hydrolysis. A two-step peptide binding event is detected in both mutants, where a conformational change occurs after a rapid equilibrium peptide binding step. The Kd for the initial peptide binding step determined by kinetic and equilibrium binding techniques is approximately 164 micromolar and 38 micromolar, respectively. The rate constants for the conformational change detected in the S679A and S679W Lon mutants are 0.74 +/- 0.10 s(-1) and 0.57 +/- 0.10 s(-1), respectively. These values are comparable to the lag rate constant determined for peptide hydrolysis (klag approximately 1 s(-1)) [Vineyard, D., et al. (2005) Biochemistry 45, 4602-4610]. Replacement of the active site Ser with Trp (S679W) allows for the detection of an ATP-dependent conformational change within the proteolytic site. The rate constant for this conformational change is 7.6 +/- 1.0 s(-1), and is essentially identical to the burst rate constant determined for ATP hydrolysis under comparable reaction conditions. Collectively, these kinetic data support a mechanism by which the binding of ATP to an allosteric site on Lon activates the proteolytic site. In this model, the energy derived from the binding of ATP minimally supports peptide cleavage by allowing peptide substrate access to the proteolytic site. However, the kinetics of peptide cleavage are enhanced by the hydrolysis of ATP.


Figures

Figure 1
Figure 1
(A) Fluorescent emission scans of S679A with non-fluorescent S2 peptide. Five micromolar S679A was incubated with 100 μM ATP and (■) 0 μM, (●) 25 μM, (◆) 100 μM of the non-fluorescent S2 peptide. The sample was excited at 290 nm and emission was monitored from 300 nm to 570 nm. No changes in tryptophan fluorescence are detected. Similar results were obtained with the S679W Lon mutant. (B) Fluorescent emission scan of S679A with S4 dansylated peptide and dansylated glutamic acid. Five micromolar S679A was incubated with 100 μM ATP and 50 μM of the S4 dansylated peptide or 50 μM of dansylated glutamic acid. The sample was excited at 290 nm and emission was monitored from 300 nm to 400 nm. A decrease in tryptophan fluorescence at 350 nm is observed with dansylated glutamic acid, however there is a greater decrease with the S4 dansyl peptide. Similar results were obtained with the S679W Lon mutant. (C). Corrected S679A tryptophan emission spectra. Five micromolar S679A and 100 μM ATP was incubated with (■) 0 μM, (●) 25 μM, (▲) 50 μM, (◆) 100 μM S4 dansyl peptide or dansylated glutamic acid. The samples were excited at 290 nm and emission was detected from 300 nm to 400 nm. The spectra shown were corrected by subtracting the emission spectra of S4 dansyl peptide with Lon and ATP from a control reaction containing dansylated glutamic acid, Lon and ATP. (D). Corrected emission spectra for the dansyl moiety on the S4 peptide. Five micromolar S679A was incubated with 100 μM ATP and (■) 0 μM, (●) 25 μM, (▲) 50 μM, (◆) 100 μM of the dansyl peptide. The sample was excited at 290 nm and emission was monitored from 450 nm to 570 nm. These spectra were corrected by subtracting the emission scan of S4 dansyl peptide with ATP and no Lon from the emission spectra of S4 dansyl peptide with Lon and ATP. An increase in dansyl fluorescence at 520 nm is observed with increasing concentrations of S4 peptide. Similar results were obtained with the S679W Lon mutant.
Figure 1
Figure 1
(A) Fluorescent emission scans of S679A with non-fluorescent S2 peptide. Five micromolar S679A was incubated with 100 μM ATP and (■) 0 μM, (●) 25 μM, (◆) 100 μM of the non-fluorescent S2 peptide. The sample was excited at 290 nm and emission was monitored from 300 nm to 570 nm. No changes in tryptophan fluorescence are detected. Similar results were obtained with the S679W Lon mutant. (B) Fluorescent emission scan of S679A with S4 dansylated peptide and dansylated glutamic acid. Five micromolar S679A was incubated with 100 μM ATP and 50 μM of the S4 dansylated peptide or 50 μM of dansylated glutamic acid. The sample was excited at 290 nm and emission was monitored from 300 nm to 400 nm. A decrease in tryptophan fluorescence at 350 nm is observed with dansylated glutamic acid, however there is a greater decrease with the S4 dansyl peptide. Similar results were obtained with the S679W Lon mutant. (C). Corrected S679A tryptophan emission spectra. Five micromolar S679A and 100 μM ATP was incubated with (■) 0 μM, (●) 25 μM, (▲) 50 μM, (◆) 100 μM S4 dansyl peptide or dansylated glutamic acid. The samples were excited at 290 nm and emission was detected from 300 nm to 400 nm. The spectra shown were corrected by subtracting the emission spectra of S4 dansyl peptide with Lon and ATP from a control reaction containing dansylated glutamic acid, Lon and ATP. (D). Corrected emission spectra for the dansyl moiety on the S4 peptide. Five micromolar S679A was incubated with 100 μM ATP and (■) 0 μM, (●) 25 μM, (▲) 50 μM, (◆) 100 μM of the dansyl peptide. The sample was excited at 290 nm and emission was monitored from 450 nm to 570 nm. These spectra were corrected by subtracting the emission scan of S4 dansyl peptide with ATP and no Lon from the emission spectra of S4 dansyl peptide with Lon and ATP. An increase in dansyl fluorescence at 520 nm is observed with increasing concentrations of S4 peptide. Similar results were obtained with the S679W Lon mutant.
Figure 2
Figure 2
Peptide binding to S679A can be monitored using the S4 dansyl peptide. The experimental time courses are shown in grey and the fitted curve is shown in black. The time courses with ATP were fit with eq 1 describing a single exponential. (A). Five micromolar S679A was incubated with 100 μM S4 dansyl peptide and rapidly mixed with 100 μM ATP. The reaction was excited at 290 nm and monitored using a 450 nm longpass filter to measure dansyl fluorescence. No changes in fluorescence were observed in the absence of ATP. (B) The reactions described in Figure 2A were also monitored for changes in Trp fluorescence by excitation at 290 nm and detecting emission with a 340 nm bandpass filter. No changes in fluorescence were observed in the absence of ATP. Identical reaction time courses were obtained when S679A was rapidly mixed with S4 peptide pre-mixed with ATP.
Figure 3
Figure 3
Equilibrium binding of S4 dansyl peptide to S679A Lon can be measured using fluorescent anisotropy. Twenty micromolar S4 dansyl peptide was incubated with 1 mM AMPPNP (10 × Kd, determined previously and reported in (36)) and changes in anisotropy were measured (excitation 340 nm emission 520 nm) by titrating in S679A Lon (0 μM - 192 μM). The data were fit with eq. 7 resulting in Kd = 35.2 ± 18.6 μM with a Hill coefficient (n) of 1.5 ± 0.1. The data shown are an average of 3 trials. Similar results were obtained in S679A and in the wild-type enzyme when nucleotide was omitted (see Results).
Figure 4
Figure 4
S4 dansyl peptide binding to S679A is dependent on peptide and ATP. (A) Five micromolar S679A and varying concentrations of S4 dansyl peptide (10, 15, 25, 35, 50, 75, 100, 150, 250, 300, 450 or 500 μM) was rapidly mixed with 100 μM ATP. The time courses were fit with eq. 1 and the resulting rate constants are plotted as a function of the corresponding peptide concentration. The data in (A) were fit with eq 6 to yield a maximum kS679A = 0.74 ± 0.10 s-1, Kd = 164 ± 35 μM, krev = 0.19 ± 0.01 s-1, n = 1.3 ± 0.2 (Table 2). (B). Five micromolar S679A and 500 μM (3× Km) S4 dansyl peptide was rapidly mixed with varying concentrations of ATP (0.5, 1, 3, 5, 10, 25 or 50 μM). The time courses were fit with eq. 1 and the resulting rate constants are plotted as a function of the corresponding ATP concentration. The data in (B) were fit with eq 5 to yield a maximum kS679A = 0.54 ± 0.04 s-1, Kd = 7.4 ± 2.5 μM, krev = 0.19 ± 0.03 s-1 (Table 2).
Figure 5
Figure 5
Intrinsic tryptophan fluorescence can be used to measure a conformational change in S679W dependent on ATP and AMPPNP. No significant changes are observed with buffer or ADP. Five micromolar S679W was rapidly mixed with buffer, 100 μM ATP, 100 μM AMPPNP or 100 μM ADP in a stopped-flow instrument. The reactions were excited at 290 nm and emission was detected using a 340 bandpass filter to detect Trp fluorescence. The reaction with ATP was fit with eq 1 describing a single exponential and the reaction with AMPPNP was fit with eq 2 describing a single exponential followed by a steady-state. The experimental time course is shown in grey and the fitted curve is shown in black.
Figure 6
Figure 6
Peptide binding to S679W can be monitored using the S4 dansyl peptide. The experimental time courses are shown in grey and the fitted curve is shown in black. (A). Five micromolar S679W was preincubated with 100 μM S4 dansyl peptide and rapidly mixed with 100 μM ATP. The reaction was excited at 290 nm and monitored using a 450 nm longpass filter to measure dansyl fluorescence. The time course with ATP was fit with eq 3 describing a double exponential. No changes in fluorescence were observed in the absence of ATP. (B). Five micromolar S679W was preincubated with 100 μM S4 dansyl peptide and rapidly mixed with 100 μM AMPPNP. The reaction was excited at 290 nm and monitored using a 450 nm longpass filter to measure dansyl fluorescence. The time course with AMPPNP was fit with eq 3 describing a double exponential. AMPPNP does support binding, however at a rate slower than ATP. The k1,S679W and k2,S679W are 0.50 s-1 and 0.04 s-1, respectively. No changes in fluorescence were observed with ADP.
Figure 6
Figure 6
Peptide binding to S679W can be monitored using the S4 dansyl peptide. The experimental time courses are shown in grey and the fitted curve is shown in black. (A). Five micromolar S679W was preincubated with 100 μM S4 dansyl peptide and rapidly mixed with 100 μM ATP. The reaction was excited at 290 nm and monitored using a 450 nm longpass filter to measure dansyl fluorescence. The time course with ATP was fit with eq 3 describing a double exponential. No changes in fluorescence were observed in the absence of ATP. (B). Five micromolar S679W was preincubated with 100 μM S4 dansyl peptide and rapidly mixed with 100 μM AMPPNP. The reaction was excited at 290 nm and monitored using a 450 nm longpass filter to measure dansyl fluorescence. The time course with AMPPNP was fit with eq 3 describing a double exponential. AMPPNP does support binding, however at a rate slower than ATP. The k1,S679W and k2,S679W are 0.50 s-1 and 0.04 s-1, respectively. No changes in fluorescence were observed with ADP.
Figure 7
Figure 7
Representative time courses for S679W interacting with the S4 dansyl peptide. All the reactions were excited at 290 nm and emission signals from the dansyl moiety in S4 were detected using a 450 nm long-pass filter. (A) Five micromolar S679W pre-incubated with 500 μM S4 was rapidly mixed with (a) 0.5; (b) 1; (c) 5 and (d) 10 μM ATP in a stopped flow apparatus. All the time courses were best fit with eq 3 describing a double exponential. The experimental time courses are shown in grey and the fitted curve is shown in black. At < 5 μM ATP, the second phase of the time courses display negative changes in fluorescence whereas in the time courses measured at ≥ 5 μM ATP, the overall changes in fluorescence were positive. (B) Five micromolar S679W pre-incubated with (a) 25; (b) 50; (c) 100 and (d) 500 μM S4 peptide were rapidly mixed with 100 μM ATP in a stopped-flow apparatus. The experimental time courses are shown in grey and the fitted curve is shown in black. The sub Kd levels of S4 (25, and 50 μM) were fit with eq. 4 (triple exponential). The 100 and 500 μM S4 time courses were fit with eq 3 (double exponential equation).
Figure 8
Figure 8
In S679W Lon the first phase is dependent on nucleotide only and the second phase is dependent on ATP and peptide. In a stopped flow apparatus, 5 μM S679W Lon was incubated with varying concentrations of S4 dansyl peptide (25, 50, 75, 100, 125, 200, 350 or 500 μM) and rapidly mixed with 100 μM ATP or 5 μM S679W Lon was incubated with 500 μM S4 dansyl peptide and rapidly mixed with varying concentrations of ATP (0.5, 1, 2, 4, 7, 10, 25 or 50 μM). The resulting time courses were fit with eq 3 or eq 4 and the resulting rate constants (k1,S679W and k2,S679W) are shown as a function of substrate concentration. (A) k1,S679W = 7.6 ± 1.0 s-1 and is independent of peptide concentration. The 0 μM S4 peptide data point (■) was obtained by fitting the time course shown in Figure 5 (S679W + ATP) to eq 1 to yield k1,S679W = 9.35 ± 0.34 s-1. (B) k1,S679W = 5.3 ± 0.6 s-1 is dependent on ATP concentration, Kd = 4.3 ± 1.9 μM, krev = 2.1 ± 0.5 s-1. The data was fit with eq 5 (C) k2,S679W = 0.57 ± 0.10 s-1 and is dependent on peptide concentration, Kd = 157 ± 8 μM, krev = 0.10 ± 0.01 s-1, n = 1.9 ± 0.1. The data was fit with eq 6 (D) k2,S679W = 1.5 ± 0.4 s-1 is dependent on ATP concentration, Kd = 9.3 ± 9.8 μM. The data was fit with eq 5. All the kinetic parameters are summarized in Table 2.
Figure 8
Figure 8
In S679W Lon the first phase is dependent on nucleotide only and the second phase is dependent on ATP and peptide. In a stopped flow apparatus, 5 μM S679W Lon was incubated with varying concentrations of S4 dansyl peptide (25, 50, 75, 100, 125, 200, 350 or 500 μM) and rapidly mixed with 100 μM ATP or 5 μM S679W Lon was incubated with 500 μM S4 dansyl peptide and rapidly mixed with varying concentrations of ATP (0.5, 1, 2, 4, 7, 10, 25 or 50 μM). The resulting time courses were fit with eq 3 or eq 4 and the resulting rate constants (k1,S679W and k2,S679W) are shown as a function of substrate concentration. (A) k1,S679W = 7.6 ± 1.0 s-1 and is independent of peptide concentration. The 0 μM S4 peptide data point (■) was obtained by fitting the time course shown in Figure 5 (S679W + ATP) to eq 1 to yield k1,S679W = 9.35 ± 0.34 s-1. (B) k1,S679W = 5.3 ± 0.6 s-1 is dependent on ATP concentration, Kd = 4.3 ± 1.9 μM, krev = 2.1 ± 0.5 s-1. The data was fit with eq 5 (C) k2,S679W = 0.57 ± 0.10 s-1 and is dependent on peptide concentration, Kd = 157 ± 8 μM, krev = 0.10 ± 0.01 s-1, n = 1.9 ± 0.1. The data was fit with eq 6 (D) k2,S679W = 1.5 ± 0.4 s-1 is dependent on ATP concentration, Kd = 9.3 ± 9.8 μM. The data was fit with eq 5. All the kinetic parameters are summarized in Table 2.
Figure 9
Figure 9
Proposed mechanism for peptide hydrolysis. The enzyme is shown as a dimer instead of a hexamer for simplicity. The ATPase and SSD (sustrate sensor and discriminatory) domains are shown in green, the protease domain is shown in blue and the active site serine is shown in red. (I) Free enzyme. (II, step 1) ATP and peptide bind in a random order. (III, step 2) A conformational change resulting from nucleotide binding. (IV, step 3) Allosteric activation of the proteolytic site accompanied by ATP hydrolysis. (V, step 4). A slow peptide delivery/translocation event. (VI, step 5) Peptide hydrolysis and product release. The rate constants in bold are measured in this study. All other rate constants have been published previously by our lab.
Scheme 1
Scheme 1
Peptide binding steps measured using the S679A Lon mutant 1. An initial peptide binding event independent of nucleotide. This step is measured using equilibrium fluorescence anisotropy 2. A conformational change step following initial binding that requires nucleotide. This step is measured using stopped- flow kinetic techniques **It should be noted that ATP binds to Lon independent of peptide. The Lon*:peptide complex contains ATP

Similar articles

Cited by

References

    1. Lee I, Berdis AJ. Adenosine triphosphate-dependent degradation of a fluorescent lambda N substrate mimic by Lon protease. Anal Biochem. 2001;291:74–83. - PubMed
    1. Thomas-Wohlever J, Lee I. Kinetic characterization of the peptidase activity of Escherichia coli Lon reveals the mechanistic similarities in ATP-dependent hydrolysis of peptide and protein substrates. Biochemistry. 2002;41:9418–9425. - PubMed
    1. Charette MF, Henderson GW, Markovitz A. ATP hydrolysis-dependent protease activity of the lon (capR) protein of Escherichia coli K-12. Proc Natl Acad Sci U S A. 1981;78:4728–4732. - PMC - PubMed
    1. Chung CH, Goldberg AL. The product of the lon (capR) gene in Escherichia coli is the ATP-dependent protease, protease La. Proc Natl Acad Sci U S A. 1981;78:4931–4935. - PMC - PubMed
    1. Goff SA, Goldberg AL. Production of abnormal proteins in E. coli stimulates transcription of lon and other heat shock genes. Cell. 1985;41:587–595. - PubMed

Publication types

MeSH terms

LinkOut - more resources