

Purification and characterization of pepsins A1 and A2 from the Antarctic rock cod Trematomus bernacchii
- PMID: 17976195
- PMCID: PMC2533623
- DOI: 10.1111/j.1742-4658.2007.06136.x
Purification and characterization of pepsins A1 and A2 from the Antarctic rock cod Trematomus bernacchii
Abstract
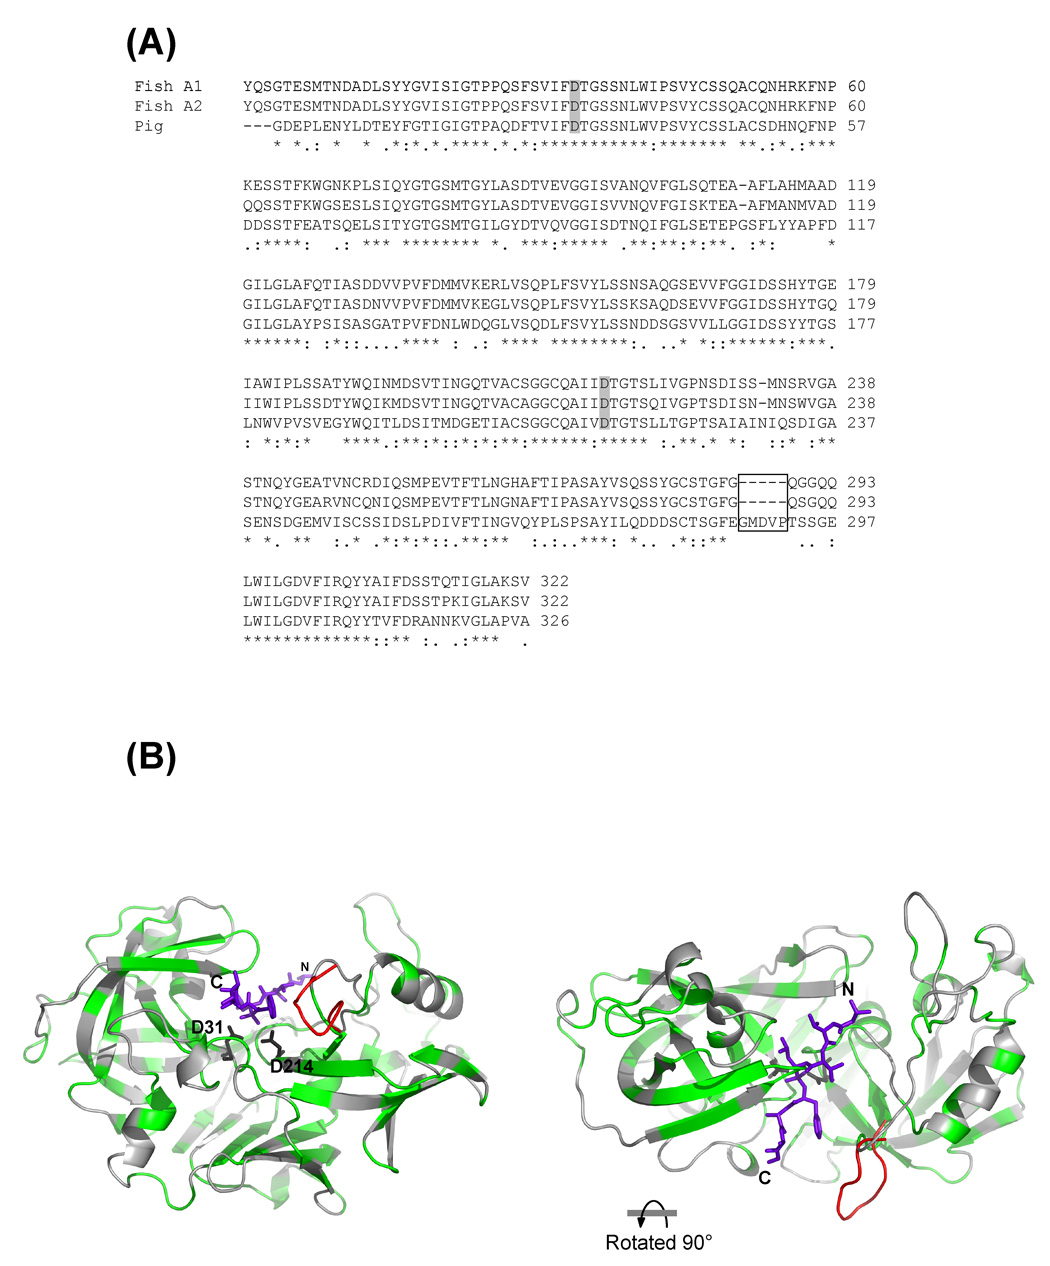
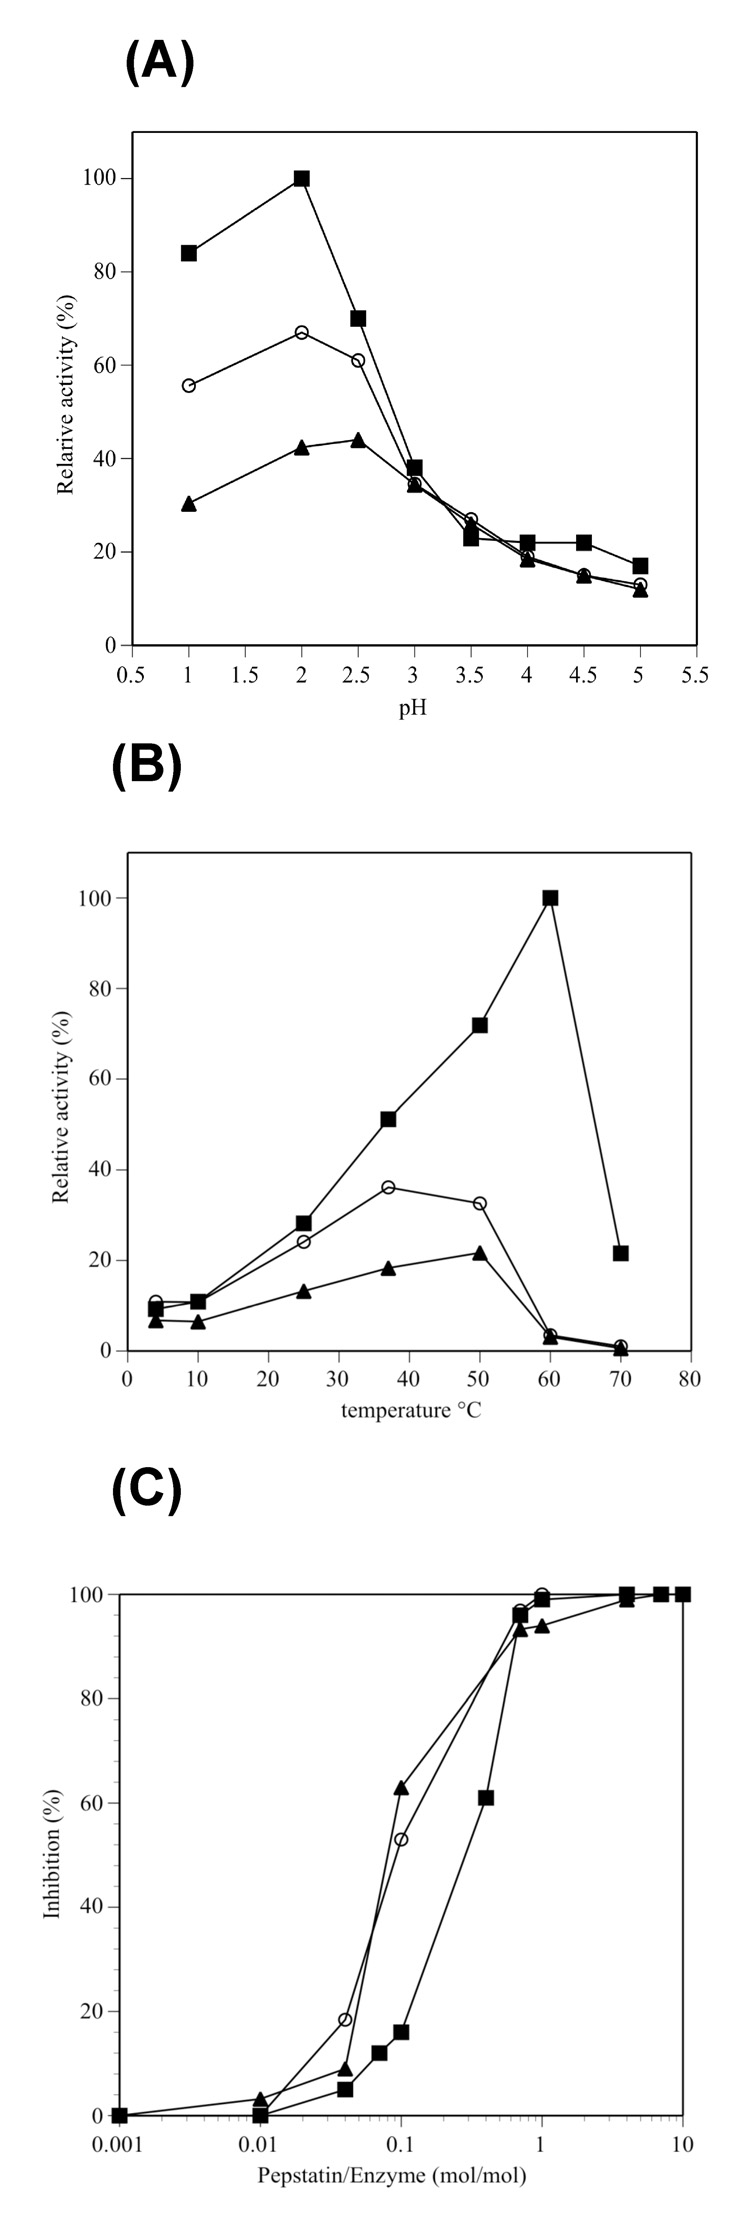
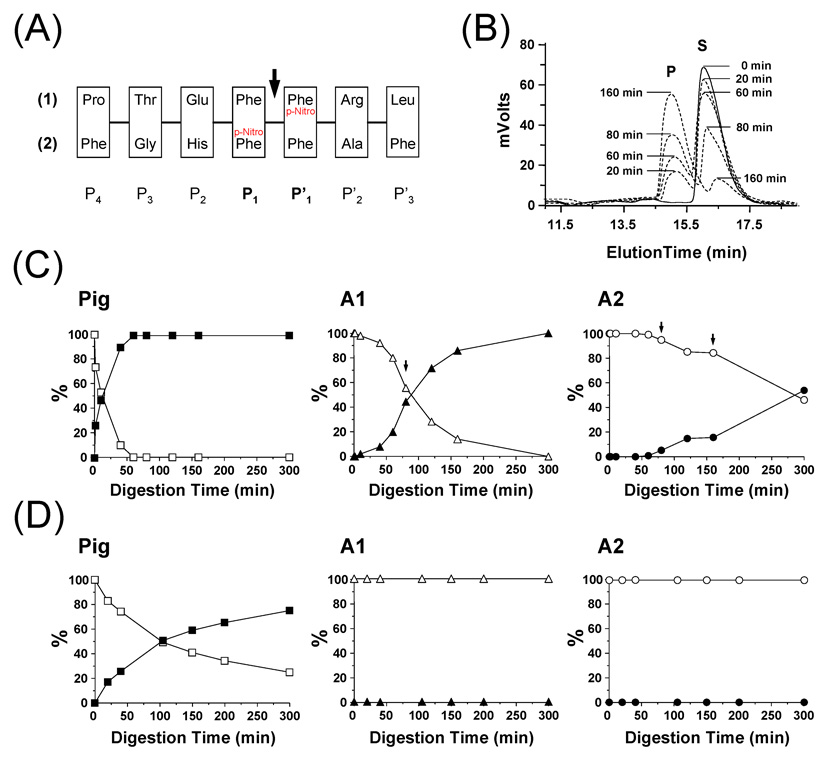
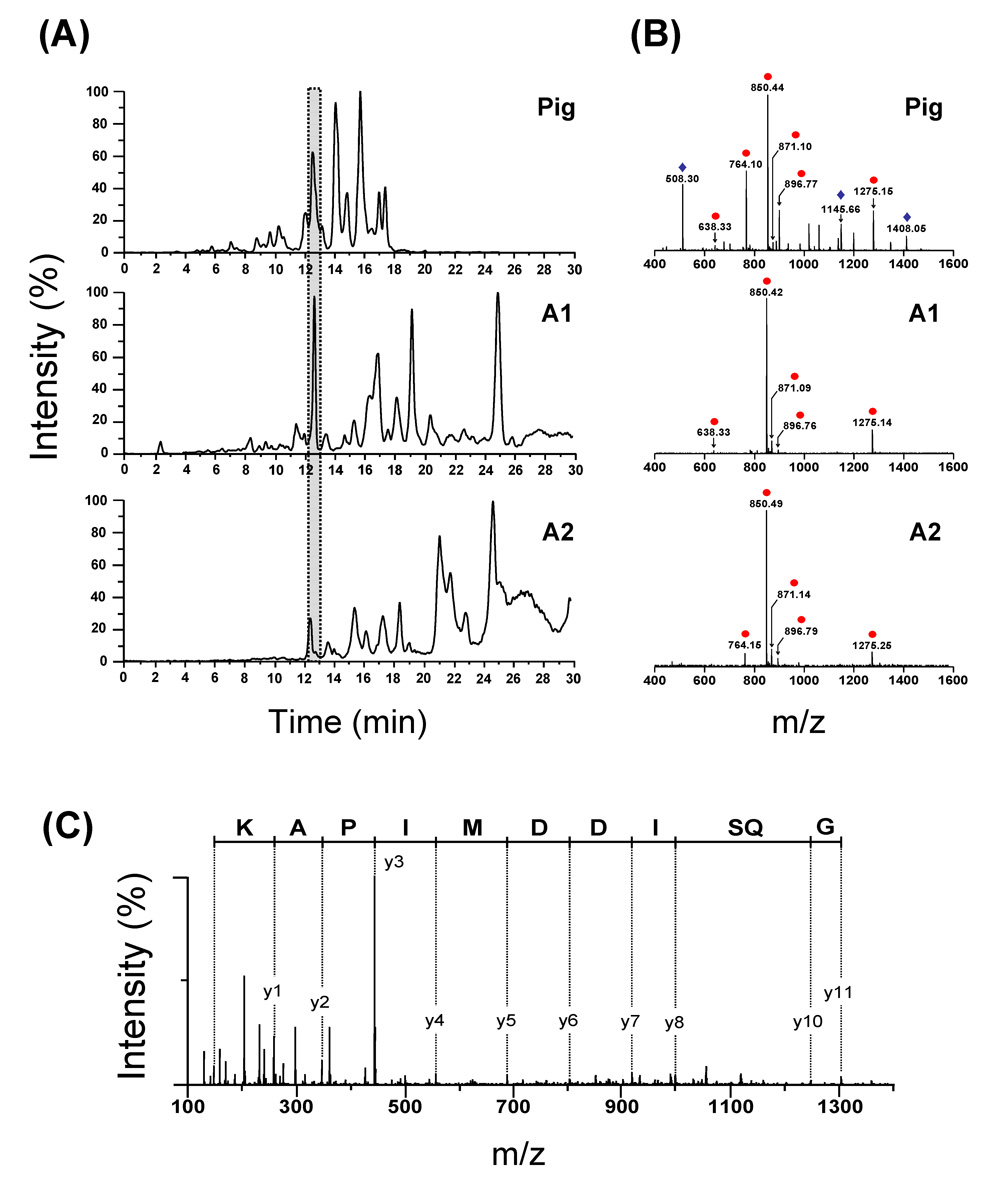
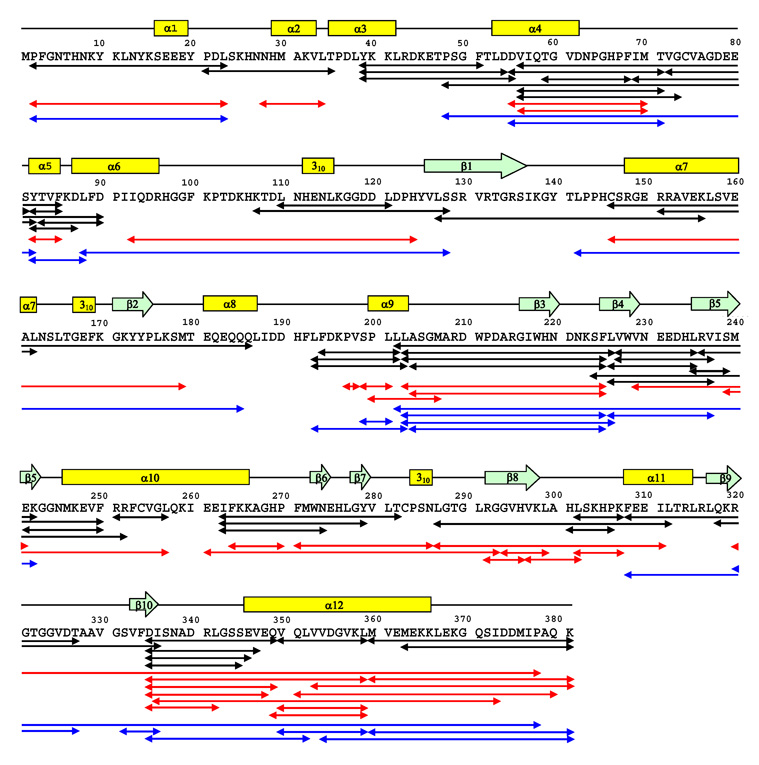
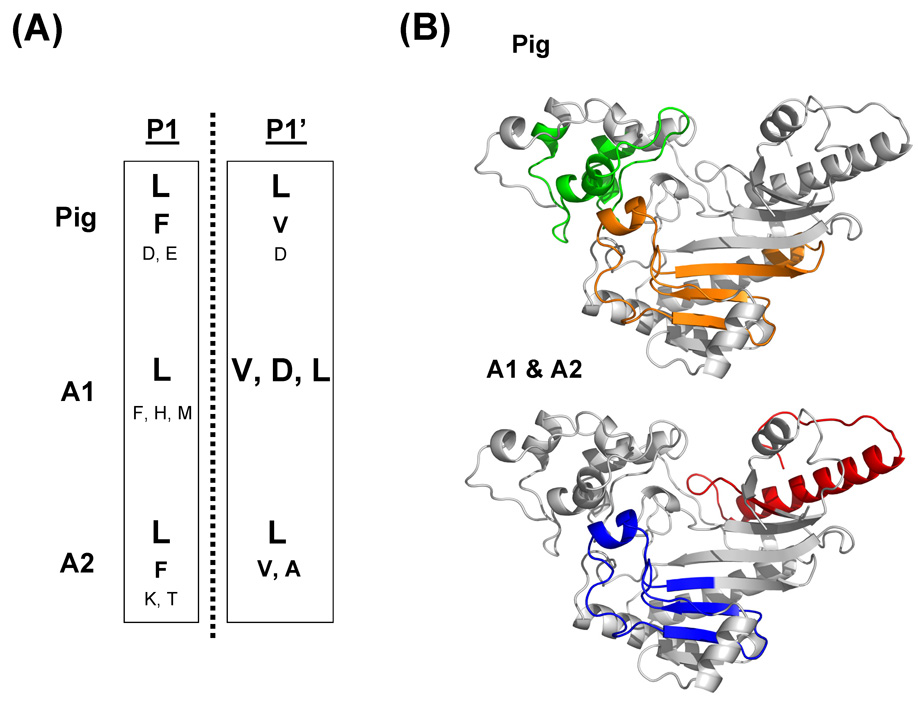
The Antarctic notothenioid Trematomus bernacchii (rock cod) lives at a constant mean temperature of -1.9 degrees C. Gastric digestion under these conditions relies on the proteolytic activity of aspartic proteases such as pepsin. To understand the molecular mechanisms of Antarctic fish pepsins, T. bernacchii pepsins A1 and A2 were cloned, overexpressed in Escherichia coli, purified and characterized with a number of biochemical and biophysical methods. The properties of these two Antarctic isoenzymes were compared to those of porcine pepsin and found to be unique in a number of ways. Fish pepsins were found to be more temperature sensitive, generally less active at lower pH and more sensitive to inhibition by pepstatin than their mesophilic counterparts. The specificity of Antarctic fish pepsins was similar but not identical to that of pig pepsin, probably owing to changes in the sequence of fish enzymes near the active site. Gene duplication of Antarctic rock cod pepsins is the likely mechanism for adaptation to the harsh temperature environment in which these enzymes must function.
Figures
Similar articles
-
Gene amplification and cold adaptation of pepsin in Antarctic fish. A possible strategy for food digestion at low temperature.Gene. 2004 Jul 21;336(2):195-205. doi: 10.1016/j.gene.2004.04.030. Gene. 2004. PMID: 15246531
-
Catalytic properties and chemical composition of pepsins from Atlantic cod (Gadus morhua).Comp Biochem Physiol B. 1990;96(2):323-30. doi: 10.1016/0305-0491(90)90382-4. Comp Biochem Physiol B. 1990. PMID: 2113846
-
Substrate and inhibitor studies with human gastric aspartic proteinases.Biochem J. 1990 May 1;267(3):665-9. doi: 10.1042/bj2670665. Biochem J. 1990. PMID: 2111133 Free PMC article.
-
Study on pepsinogens and pepsins from snakehead (Channa argus).J Agric Food Chem. 2009 Nov 25;57(22):10972-8. doi: 10.1021/jf902548p. J Agric Food Chem. 2009. PMID: 19877637
-
Comparative pepstatin inhibition studies on individual human pepsins and pepsinogens 1,3 and 5(gastricsin) and pig pepsin A.J Enzyme Inhib Med Chem. 2003 Jun;18(3):209-17. doi: 10.1080/1475636031000076888. J Enzyme Inhib Med Chem. 2003. PMID: 14506911
Cited by
-
Gas-Phase Hydrogen/Deuterium Scrambling in Negative-Ion Mode Tandem Mass Spectrometry.J Am Soc Mass Spectrom. 2019 May;30(5):855-863. doi: 10.1007/s13361-019-02143-4. Epub 2019 Feb 25. J Am Soc Mass Spectrom. 2019. PMID: 30805882 Free PMC article.
-
Hydrogen exchange mass spectrometry: are we out of the quicksand?J Am Soc Mass Spectrom. 2012 Jun;23(6):1003-10. doi: 10.1007/s13361-012-0377-z. Epub 2012 Apr 3. J Am Soc Mass Spectrom. 2012. PMID: 22476891 Free PMC article. Review.
-
Advances in Hydrogen/Deuterium Exchange Mass Spectrometry and the Pursuit of Challenging Biological Systems.Chem Rev. 2022 Apr 27;122(8):7562-7623. doi: 10.1021/acs.chemrev.1c00279. Epub 2021 Sep 7. Chem Rev. 2022. PMID: 34493042 Free PMC article. Review.
-
Minimizing carry-over in an online pepsin digestion system used for the H/D exchange mass spectrometric analysis of an IgG1 monoclonal antibody.J Am Soc Mass Spectrom. 2012 Dec;23(12):2140-8. doi: 10.1007/s13361-012-0485-9. Epub 2012 Sep 20. J Am Soc Mass Spectrom. 2012. PMID: 22993047
-
Accessing the reproducibility and specificity of pepsin and other aspartic proteases.Biochim Biophys Acta. 2013 Jun;1834(6):1222-9. doi: 10.1016/j.bbapap.2012.10.003. Epub 2012 Oct 10. Biochim Biophys Acta. 2013. PMID: 23063535 Free PMC article.
References
-
- Brodeur JC, Calvo J, Clarke A, Johnston IA. Myogenic cell cycle duration in Harpagifer species with sub-Antarctic and Antarctic distributions: evidence for cold compensation. J Exp Biol. 2003;206:1011–1016. - PubMed
-
- Detrich HW., 3rd Microtubule assembly in cold-adapted organisms: functional properties and structural adaptations of tubulins from antarctic fishes. Comp Biochem Physiol A Physiol. 1997;118:501–513. - PubMed
-
- D'Avino R, Caruso C, Camardella L, Schninà ME, Rutigliano B, Romano M, Carratore V, Barra D, di Prisco G. An overwiew of the molecular structure and funtional properties of the hemoglobins of a cold-adapted Antarctic teleost. Berlin: Springer-Verlag; 1991.
Publication types
MeSH terms
Substances
Grants and funding
LinkOut - more resources
Full Text Sources
Other Literature Sources
