. 2007;8(11):R232.
doi: 10.1186/gb-2007-8-11-r232.

Determinants of protein function revealed by combinatorial entropy optimization

Affiliations

Determinants of protein function revealed by combinatorial entropy optimization

Boris Reva et al. Genome Biol. 2007.

Abstract

We use a new algorithm (combinatorial entropy optimization [CEO]) to identify specificity residues and functional subfamilies in sets of proteins related by evolution. Specificity residues are conserved within a subfamily but differ between subfamilies, and they typically encode functional diversity. We obtain good agreement between predicted specificity residues and experimentally known functional residues in protein interfaces. Such predicted functional determinants are useful for interpreting the functional consequences of mutations in natural evolution and disease.


Figures

Figure 1
Figure 1
Simple example illustrating the essence of the algorithm. The input is a multiple sequence alignment (a protein family) in which residue conservation patterns are not obvious, except for highly conserved residues (dark blue blocks). More subtle but functionally important conservation patterns become evident after reordering the sequences and grouping them into subfamilies (output). In our algorithm, it is precisely the conservation pattern of the specificity residues (red blocks) that determines the grouping. For example, the third specificity residue is conserved as Q in the first subfamily, as R in the second, as E in the third, and as L in the fourth. An optimal subfamily arrangement of sequences has a minimal value of a sum of combinatorial entropy differences (for details, see Materials and methods).
Figure 2
Figure 2
Typical results and predictive power of the CEO method illustrated in the family of small GTPases (G-domains). The analysis used 126 distinct human sequences of the Ras superfamily of GTPase domains obtained after removing redundant identical copies and gappy (>30% gaps relative to rasH) sequences from the 284 protein domain sequences in the PFAM Protein Family Database (version 20), which includes ras, rab, and rho subfamilies. (a) Alignments of 22 specificity residues (numbered as in RasH) in the two largest ras and rho subfamilies; these residues (out of a total of about 190) carry most of the information for the distinction between functional subfamilies; note the conservation of residue type within each subfamily and nonconservation between subfamilies. (b) Presence of the computed specificity residues in known molecular interfaces (marked '#') of three GTPases (RasH, RhoA, and CDC42). Seventeen of the 22 specificity residues are in these interfaces (yellow numbers). Nine of the specificity residues are in the functionally important switch I (magenta numbers) and switch II (orange numbers) regions, which are involved in sensing and/or communicating the differences between the GTP and GDP states. CEO, combinatorial entropy optimization.
Figure 3
Figure 3
The predicted specificity residues of the human Ras family map to known functional sites in 3D. The specificity residues (marked '#' in Figure 2), such as the switch I and II regions, are separated along the sequence, but end up in functional positions near the active site, poised to modulate the interaction with protein partners such as the guanine nucleotide exchange factor Sos (colors as in fig. 2). Because the computation of specificity residues uses no information about known three-dimensional structures, molecular complexes, or interactions, the agreement between the computed specificity residues and their location in the experimentally observed interfaces illustrates the predictive power of the method.
Figure 4
Figure 4
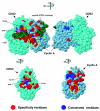
The specificity residues in the complex of cell division protein kinase CDK2 and cyclin A. These predicted functional residues (red and blue) are predominantly on the front (left) rather than the back (right) of the functional complex and reflect a remarkable asymmetry indicative of protein-protein interactions on the front face. We propose a novel hypothetical functional cavity on the surface of the complex (yellow circle). Other colors: green, bound peptide; orange, phosphorylation sites Y15 and T160; and pink, ATP. Coordinates from data set 2cci of the Protein Data Bank.
Figure 5
Figure 5
The specificity residues of the ankyrin repeat family. The specificity residues (red) of p19-INK4D (CDN2D) are concentrated on one molecular face in the three-dimensional structure (Protein Data Bank: 1blx; complex with cyclin-dependent kinase [CDK6]). As predicted, many of these residues are in the binding site. Colors as in Figure 4. The specificity residues for p19 were calculated from the PFAM alignment of ankyrin repeats and then mapped onto each of the three ankyrin repeats (residues 41 to 72, 73 to 105, and 106 to 137) of P19; the cyan structure contains all three repeats.
Figure 6
Figure 6
Value landscape of the contrast function for a large protein family illustrating the optimization process. The algorithm searches for the minimal value of the contrast function (a combinatorial entropy difference [Equation 6]) by systematic exploration of different clusterings (horizontal axis) and of different values of the granularity parameter A (vertical axis). The overall minimum (circle in red area, lower right, A = 0.68, value of normalized contrast function -187) determines which protein is in which subfamily and which residues contribute most to the specificity patterns across the subfamilies. Here, the value landscape (color contours, values normalized by the number of residues [283 columns] in the alignment) was computed for a multiple alignment of 390 protein kinases [36] with 0.0 <A < 1.0. Note that the lowest entropy value at A = 1 is far from the overall minimum, indicating the utility of this parameter.
Figure 7
Figure 7
Definition of specificity residues based on entropy values. Combinatorial entropy difference as a function of residue position (in rank order) for the actual (solid line) and randomized (dashed line) multiple alignment of 390 protein kinase sequences [36]. Deviations from the linear fit to the entropy curve define the specificity region (yellow, about 20 residues, conserved in subfamilies but varying between subfamilies) and conserved region (blue, about 50 residues, conserved across all subfamilies). The randomized alignment, obtained by independently shuffling residues in each column of the original alignment, serves as a point of reference. The shuffling does not affect the residue content in the columns, but it washes out the subfamily distinctions. The greater the differences between the native and the randomized entropy curves, the more reliable the corresponding prediction of specificity residues. To automate visual parsing of the extreme ends of the entropy plots, we perform a simple linear fit to the central region, covering a fraction P = 0.5 to 0.7 (depending on the length of the alignment) of the sequence length (horizontal range). The line segment is centered at a point corresponding to the best linear fit. To identify the turning points at the extremes, we compute the root mean square deviation δp=<(ΔSi<ΔS>)2> from a simple line in the central region and record the points outside of the central region where the curve deviates by more than δp from the extrapolated line segment. In most cases, this simple procedure is in agreement with visual identification of downturn and upturn at the extremes. A reasonable subset of specificity residues (low end of entropy difference) and conserved residues (high end) can then be read off from the horizontal axis of the entropy plot.

Similar articles

Cited by

References

    1. Hussain SP, Hofseth LJ, Harris CC. Tumor suppressor genes: at the crossroads of molecular carcinogenesis, molecular epidemiology and human risk assessment. Lung Cancer. 2001;(Suppl 2):S7–S15. doi: 10.1016/S0169-5002(01)00339-7. - DOI - PubMed
    1. Heo WD, Meyer T. Switch-of-function mutants based on morphology classification of Ras superfamily small GTPases. Cell. 2003;113:315–328. doi: 10.1016/S0092-8674(03)00315-5. - DOI - PubMed
    1. Yang Z, Ro S, Rannala B. Likelihood models of somatic mutation and codon substitution in cancer genes. Genetics. 2003;165:695–705. - PMC - PubMed
    1. Greenblatt MS, Beaudet JG, Gump JR, Godin KS, Trombley L, Koh J, Bond JP. Detailed computational study of p53 and p16: using evolutionary sequence analysis and disease-associated mutations to predict the functional consequences of allelic variants. Oncogene. 2003;22:1150–1163. doi: 10.1038/sj.onc.1206101. - DOI - PubMed
    1. Xi T, Jones IM, Mohrenweiser HW. Many amino acid substitution variants identified in DNA repair genes during human population screenings are predicted to impact protein function. Genomics. 2004;83:970–979. doi: 10.1016/j.ygeno.2003.12.016. - DOI - PubMed

Publication types

LinkOut - more resources