

PARP inhibition or gene deficiency counteracts intraepidermal nerve fiber loss and neuropathic pain in advanced diabetic neuropathy
- PMID: 17976390
- PMCID: PMC3057075
- DOI: 10.1016/j.freeradbiomed.2007.09.013
PARP inhibition or gene deficiency counteracts intraepidermal nerve fiber loss and neuropathic pain in advanced diabetic neuropathy
Abstract
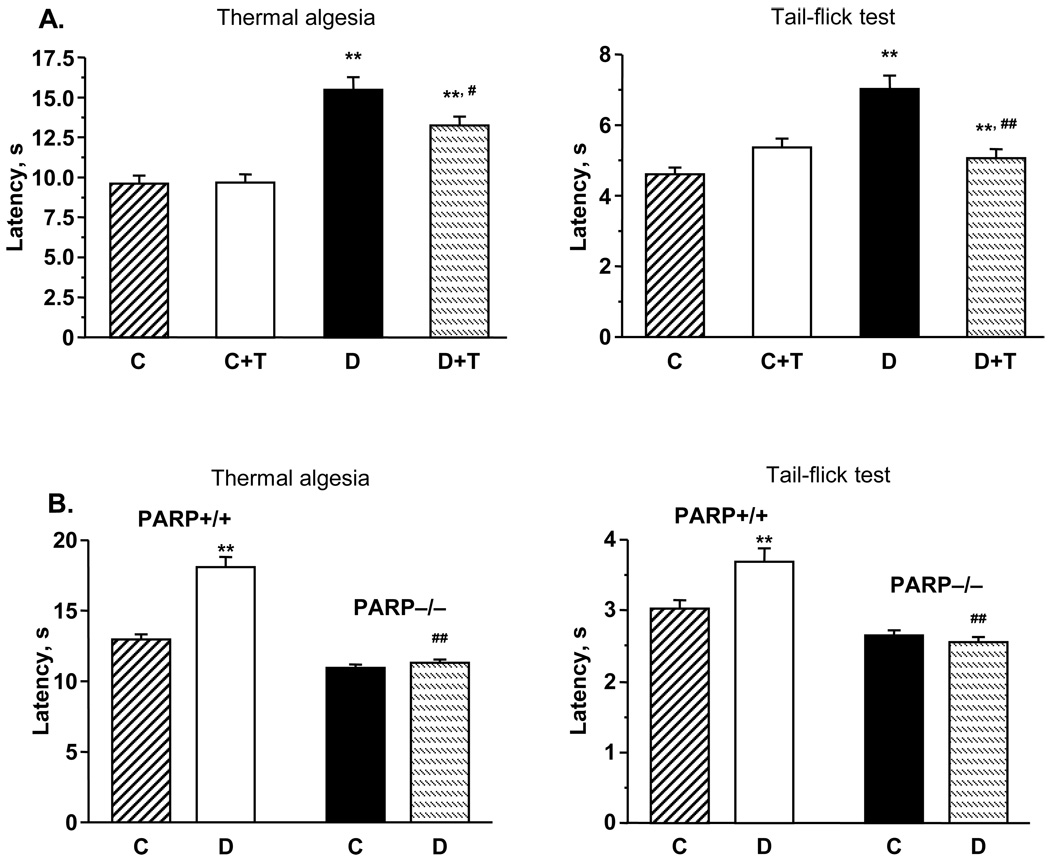
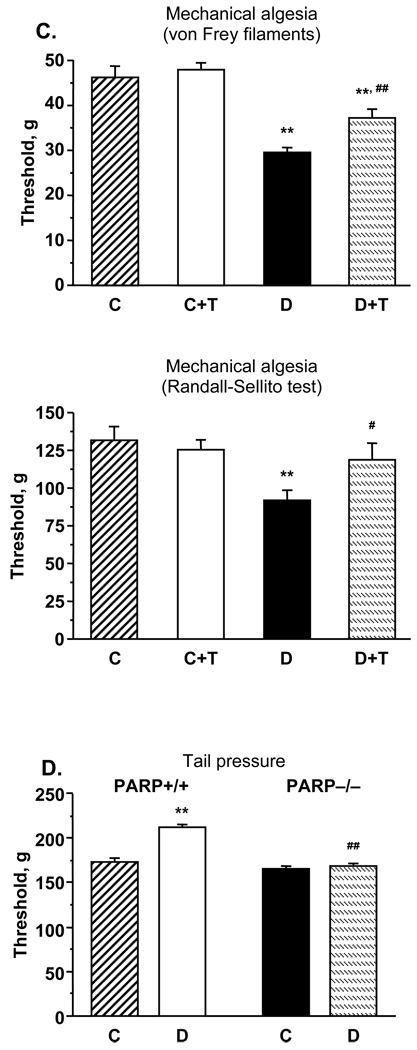
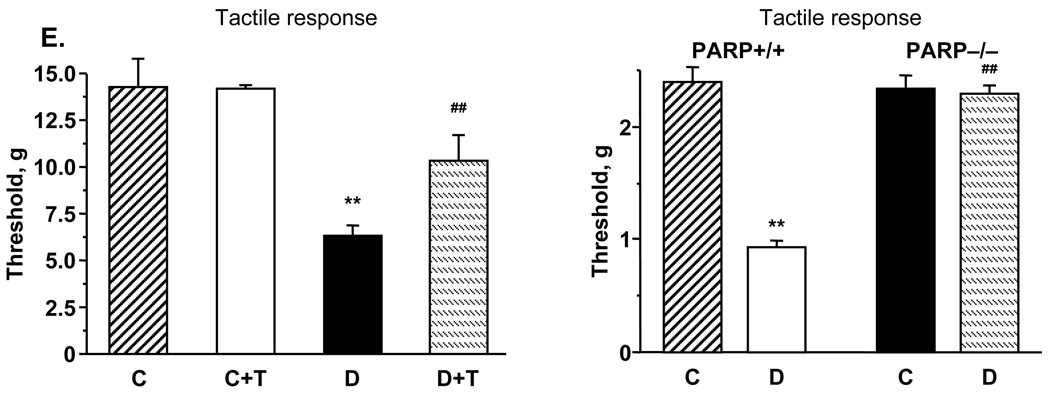
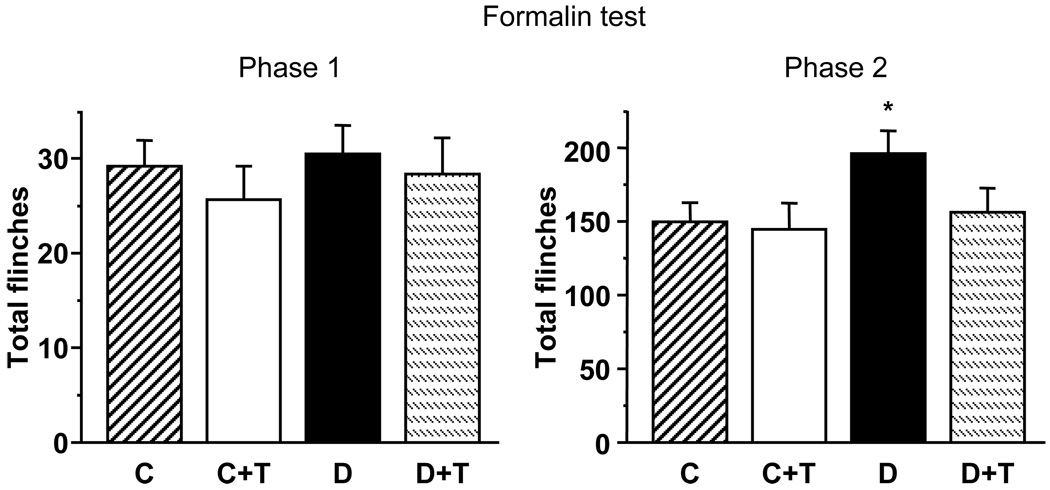
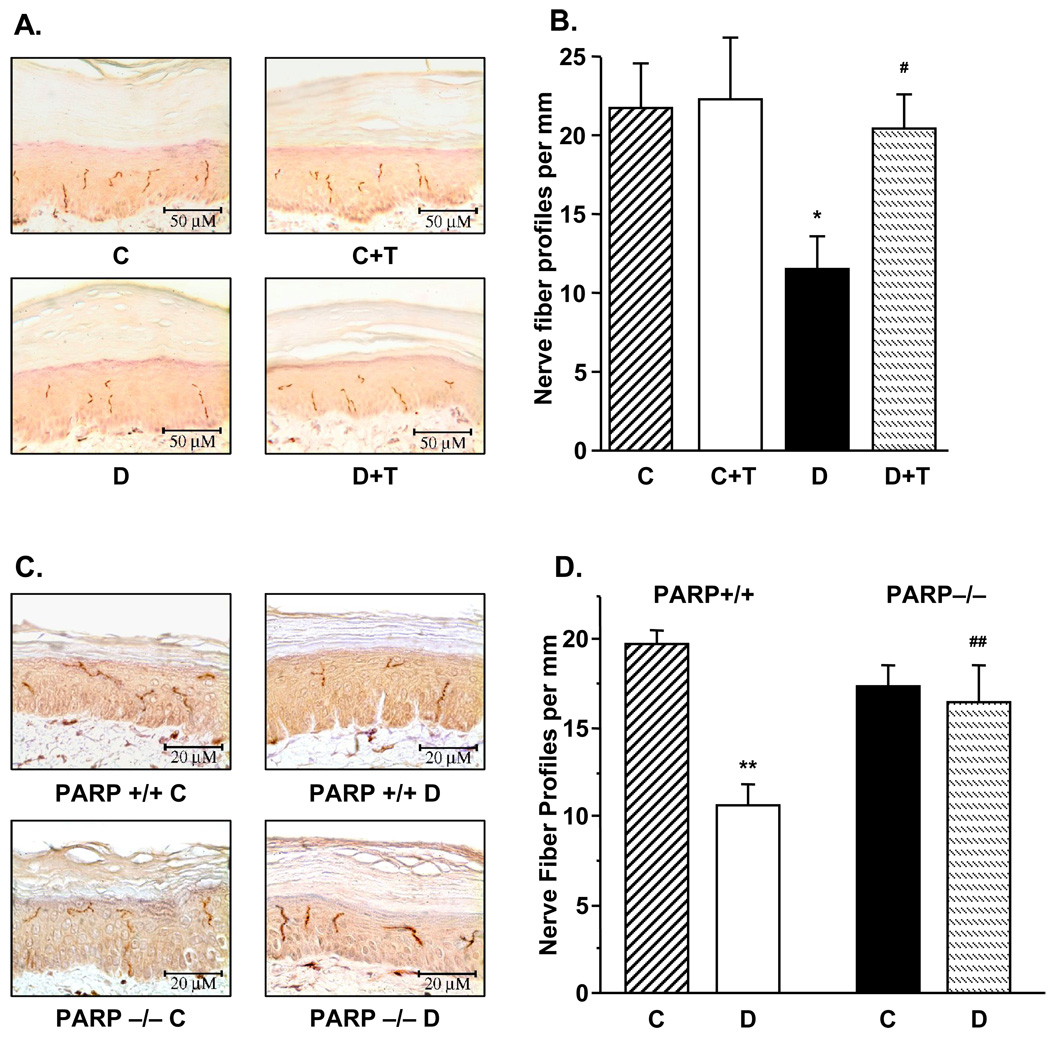
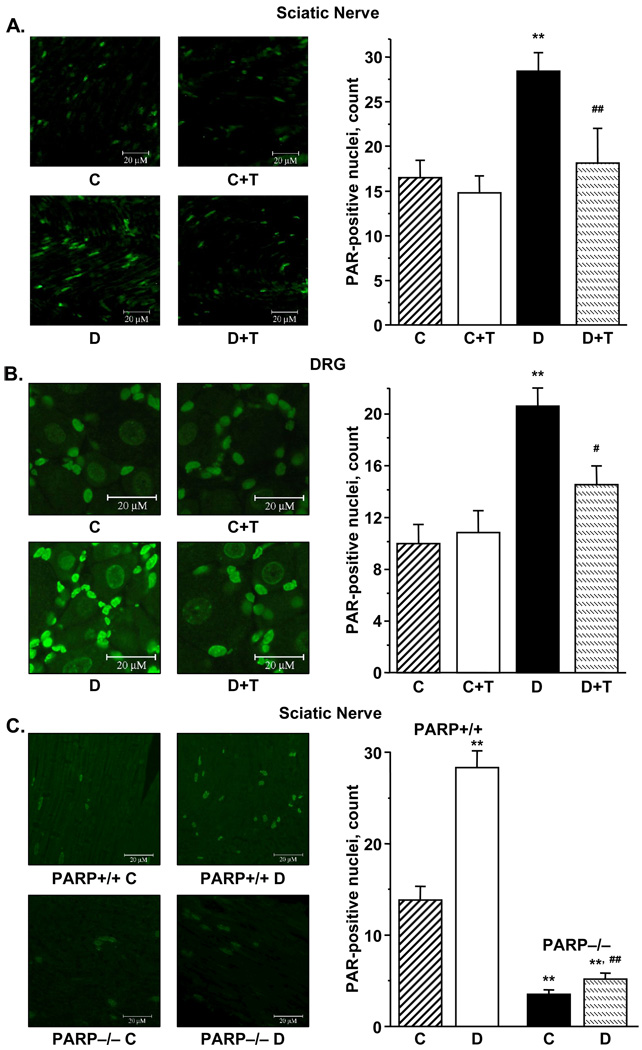
Evidence that poly(ADP-ribose) polymerase (PARP) activation plays an important role in diabetic complications is emerging. This study evaluated the role of PARP in rat and mouse models of advanced diabetic neuropathy. The orally active PARP inhibitor 10-(4-methylpiperazin-1-ylmethyl)-2H-7-oxa-1,2-diaza-benzo[de]anthracen-3-one (GPI-15427; formulated as a mesilate salt, 30 mg kg(-1) day(-1) in the drinking water for 10 weeks after the first 2 weeks without treatment) at least partially prevented PARP activation in peripheral nerve and DRG neurons, as well as thermal hypoalgesia, mechanical hyperalgesia, tactile allodynia, exaggerated response to formalin, and, most importantly, intraepidermal nerve fiber degeneration in streptozotocin-diabetic rats. These findings are consistent with the lack of small sensory nerve fiber dysfunction in diabetic PARP -/- mice. Furthermore, whereas diabetic PARP +/+ mice displayed approximately 46% intraepidermal nerve fiber loss, diabetic PARP -/- mice retained completely normal intraepidermal nerve fiber density. In conclusion, PARP activation is an important contributor to intraepidermal nerve fiber degeneration and functional changes associated with advanced Type 1 diabetic neuropathy. The results support a rationale for the development of potent and low-toxicity PARP inhibitors and PARP inhibitor-containing combination therapies.
Figures
Comment in
-
Poly(ADP-ribose) polymerase inhibition as a novel therapeutic approach against intraepidermal nerve fiber loss and neuropathic pain associated with advanced diabetic neuropathy: a commentary on "PARP Inhibition or gene deficiency counteracts intraepidermal nerve fiber loss and neuropathic pain in advanced diabetic neuropathy".Free Radic Biol Med. 2008 Mar 15;44(6):969-71. doi: 10.1016/j.freeradbiomed.2007.12.020. Epub 2008 Jan 14. Free Radic Biol Med. 2008. PMID: 18194675 Free PMC article. No abstract available.
Similar articles
-
Poly(ADP-ribose)polymerase inhibition counteracts renal hypertrophy and multiple manifestations of peripheral neuropathy in diabetic Akita mice.Int J Mol Med. 2011 Oct;28(4):629-35. doi: 10.3892/ijmm.2011.709. Epub 2011 May 23. Int J Mol Med. 2011. PMID: 21617845 Free PMC article.
-
Poly(ADP-ribose) polymerase inhibition as a novel therapeutic approach against intraepidermal nerve fiber loss and neuropathic pain associated with advanced diabetic neuropathy: a commentary on "PARP Inhibition or gene deficiency counteracts intraepidermal nerve fiber loss and neuropathic pain in advanced diabetic neuropathy".Free Radic Biol Med. 2008 Mar 15;44(6):969-71. doi: 10.1016/j.freeradbiomed.2007.12.020. Epub 2008 Jan 14. Free Radic Biol Med. 2008. PMID: 18194675 Free PMC article. No abstract available.
-
Poly(ADP-ribose) polymerase (PARP) inhibition counteracts multiple manifestations of kidney disease in long-term streptozotocin-diabetic rat model.Biochem Pharmacol. 2010 Apr 1;79(7):1007-14. doi: 10.1016/j.bcp.2009.11.018. Epub 2009 Nov 27. Biochem Pharmacol. 2010. PMID: 19945439 Free PMC article.
-
Diabetic painful and insensate neuropathy: pathogenesis and potential treatments.Neurotherapeutics. 2009 Oct;6(4):638-47. doi: 10.1016/j.nurt.2009.07.004. Neurotherapeutics. 2009. PMID: 19789069 Free PMC article. Review.
-
Epidermal nerve fiber quantification in the assessment of diabetic neuropathy.Acta Histochem. 2008;110(5):351-62. doi: 10.1016/j.acthis.2007.12.004. Epub 2008 Apr 1. Acta Histochem. 2008. PMID: 18384843 Free PMC article. Review.
Cited by
-
New therapeutic and biomarker discovery for peripheral diabetic neuropathy: PARP inhibitor, nitrotyrosine, and tumor necrosis factor-{alpha}.Endocrinology. 2010 Jun;151(6):2547-55. doi: 10.1210/en.2009-1342. Epub 2010 Mar 31. Endocrinology. 2010. PMID: 20357221 Free PMC article.
-
Co-treatment With BGP-15 Exacerbates 5-Fluorouracil-Induced Gastrointestinal Dysfunction.Front Neurosci. 2019 May 8;13:449. doi: 10.3389/fnins.2019.00449. eCollection 2019. Front Neurosci. 2019. PMID: 31139044 Free PMC article.
-
Pioglitazone Inhibits the Development of Hyperalgesia and Sensitization of Spinal Nociresponsive Neurons in Type 2 Diabetes.J Pain. 2016 Mar;17(3):359-73. doi: 10.1016/j.jpain.2015.11.006. Epub 2015 Dec 12. J Pain. 2016. PMID: 26687453 Free PMC article.
-
Triglyceride, nonesterified fatty acids, and prediabetic neuropathy: role for oxidative-nitrosative stress.Free Radic Biol Med. 2012 Apr 15;52(8):1255-63. doi: 10.1016/j.freeradbiomed.2012.01.029. Epub 2012 Feb 4. Free Radic Biol Med. 2012. PMID: 22366714 Free PMC article.
-
Triglyceride-lowering effect of the aldose reductase inhibitor cemtirestat-another factor that may contribute to attenuation of symptoms of peripheral neuropathy in STZ-diabetic rats.Naunyn Schmiedebergs Arch Pharmacol. 2020 Apr;393(4):651-661. doi: 10.1007/s00210-019-01769-1. Epub 2019 Dec 5. Naunyn Schmiedebergs Arch Pharmacol. 2020. PMID: 31802170
References
-
- Jagtap P, Szabo C. Poly(ADP-ribose) polymerase and the therapeutic effects of its inhibitors. Nat. Rev. Drug Discov. 2005;4:421–440. - PubMed
-
- Garcia Soriano F, Virag L, Jagtap P, Szabo E, Mabley JG, Liaudet L, Marton A, Hoyt DG, Murthy KG, Salzman AL, Southan GJ, Szabo C. Diabetic endothelial dysfunction: the role of poly(ADP-ribose) polymerase activation. Nat. Med. 2001;7:108–113. - PubMed
-
- Pacher P, Liaudet L, Soriano FG, Mabley JG, Szabo E, Szabo C. The role of poly(ADP-ribose) polymerase activation in the development of myocardial and endothelial dysfunction in diabetes. Diabetes. 2002;51:514–521. - PubMed
-
- Obrosova IG, Li F, Abatan OI, Forsell MA, Komjati K, Pacher P, Szabo C, Stevens MJ. Role of poly(ADP-ribose) polymerase activation in diabetic neuropathy. Diabetes. 2004;53:711–720. - PubMed
-
- Li F, Szabo C, Pacher P, Southan GJ, Abatan OI, Charniauskaya T, Stevens MJ, Obrosova IG. Evaluation of orally active poly(ADP-ribose) polymerase inhibitor in streptozotocin-diabetic rat model of early peripheral neuropathy. Diabetologia. 2004;47:710–717. - PubMed
Publication types
MeSH terms
Substances
Grants and funding
LinkOut - more resources
Full Text Sources
Medical
Molecular Biology Databases
