. 2007 Dec 7;374(4):1114-28.
doi: 10.1016/j.jmb.2007.10.025. Epub 2007 Oct 16.

Conformational instability of the cholera toxin A1 polypeptide

Affiliations

Conformational instability of the cholera toxin A1 polypeptide

Abhay H Pande et al. J Mol Biol. .

Abstract

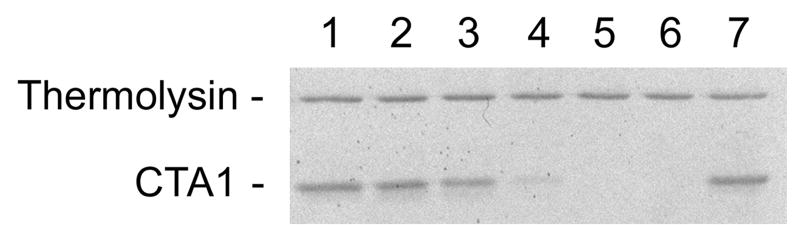
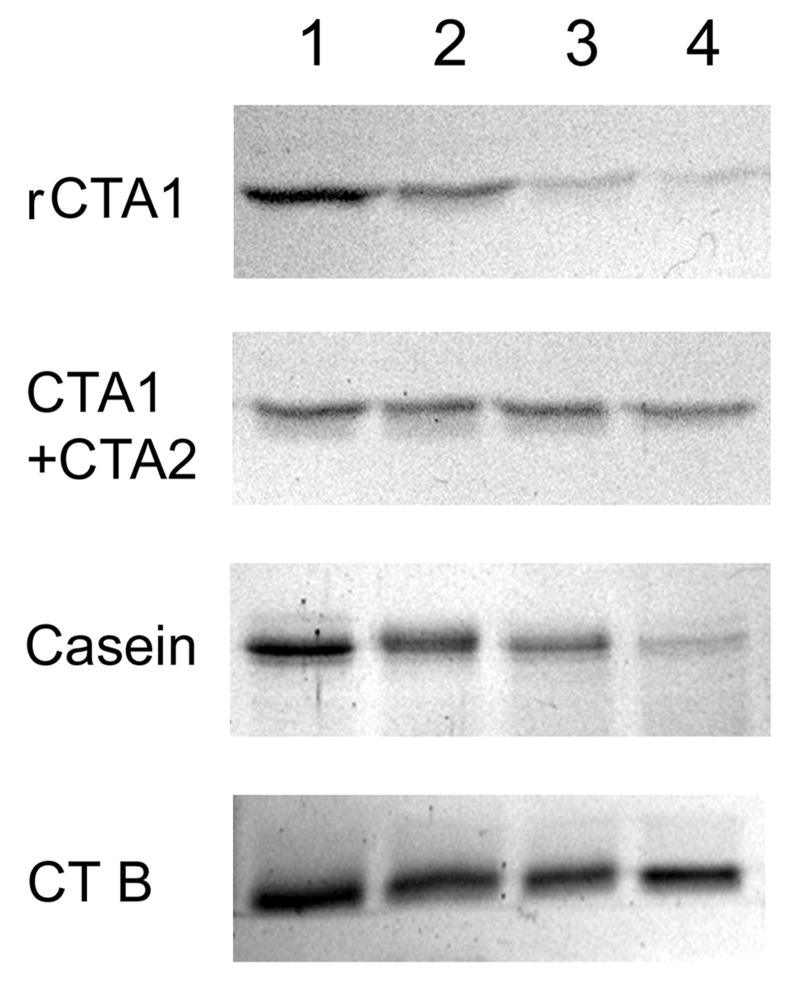
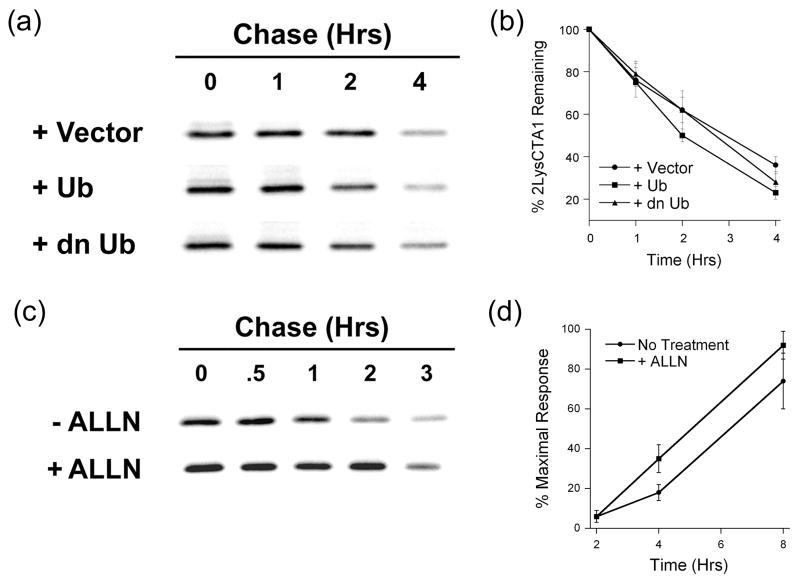
Cholera toxin (CT) moves from the cell surface to the endoplasmic reticulum (ER) by vesicular transport. In the ER, the catalytic CTA1 subunit dissociates from the holotoxin and enters the cytosol by exploiting the quality control system of ER-associated degradation (ERAD). It is hypothesized that CTA1 triggers its ERAD-mediated translocation into the cytosol by masquerading as a misfolded protein, but the process by which CTA1 activates the ERAD system remains unknown. Here, we directly assess the thermal stability of the isolated CTA1 polypeptide by biophysical and biochemical methods and correlate its temperature-dependent conformational state with susceptibility to degradation by the 20S proteasome. Measurements with circular dichroism and fluorescence spectroscopy demonstrated that CTA1 is a thermally unstable protein with a disordered tertiary structure and a disturbed secondary structure at 37 degrees C. A protease sensitivity assay likewise detected the temperature-induced loss of native CTA1 structure. This protease-sensitive conformation was not apparent when CTA1 remained covalently associated with the CTA2 subunit. Thermal instability in the dissociated CTA1 polypeptide could thus allow it to appear as a misfolded protein for ERAD-mediated export to the cytosol. In vitro, the disturbed conformation of CTA1 at 37 degrees C rendered it susceptible to ubiquitin-independent degradation by the core 20S proteasome. In vivo, CTA1 was also susceptible to degradation by a ubiquitin-independent proteasomal mechanism. ADP-ribosylation factor 6, a cytosolic eukaryotic protein that enhances the enzymatic activity of CTA1, stabilized the heat-labile conformation of CTA1 and protected it from in vitro degradation by the 20S proteasome. Thermal instability in the reduced CTA1 polypeptide has not been reported before, yet both the translocation and degradation of CTA1 may depend upon this physical property.


Figures

Figure 1
Figure 1
Ribbon diagrams of CT and the CTA subunits. (a-c): Structural models for CT (a), the disulfide-linked CTA1/CTA2 heterodimer (b), and the isolated CTA1 polypeptide (c) are based upon the X-ray crystal structure of CT as determined by O'Neal et al. (Protein Data Bank entry 1S5F). Images were generated using the WebLab Viewer Lite molecular modeling and visualization software.
Figure 2
Figure 2
Reductive separation of CTA1 from CTA2. (a): 1 µg samples of the CTA1/CTA2 heterodimer were exposed to 10 mM β-ME for 1 minute at 4°C or 37°C before loading on a non-reducing SDS-PAGE gel. 1 µg of a CTA1/CTA2 heterodimer that was not exposed to β-ME was also run on the gel. Samples were visualized by Coomassie staining, which does not detect the dissociated 5 kDa CTA2 subunit. Lane 1, disulfide-bridged CTA1/CTA2; lane 2, blank; lane 3, CTA1/CTA2 reduction at 4°C; lane 4, CTA1/CTA2 reduction at 37°C. (b): A 1 µg sample of the CTA1/CTA2 heterodimer was exposed to 10 mM β-ME for 1 minute at 4°C. Size exclusion column chromatography was subsequently run with a Superdex G-75 column on an ÄKTA purifier. A 1 µg CTA1/CTA2 heterodimer sample that was not exposed to β-ME was also run through the column. The unreduced and reduced heterodimers were individually eluted at 4°C in a buffer of 150 mM KCl and 25 mM Tris (pH 7.4) at a rate of 1 ml / minute. Sample elution was detected by absorbance at 280 nm, which after 125 mls of elution could not definitively distinguish between the weak CTA2 signal and the background noise from β-ME.
Figure 3
Figure 3
Temperature-induced unfolding of CTA1/CTA2. (a-f): The thermal denaturation of a purified CTA1/CTA2 heterodimer in either reduced (a-c) or disulfide-bridged (d-f) forms was monitored by near-UV CD (a, d), tryptophan fluorescence (b, e), and far-UV CD (c, f). Both CD and fluorescence measurements were conducted near-simultaneously on the same sample after equilibration at each temperature for 4 minutes. Protein concentration was 34 µg /ml in 20 mM Na-phosphate (pH 7.0) containing 150 mM NaCl ± 10 mM β-ME. The change in color from blue to red corresponds to a change in temperature from 18°C to 65°C. (g-i): Thermal unfolding profiles for the CTA1/CTA2 heterodimer in either reduced (blue) or disulfide-bridged (red) forms were derived from the data presented in panels a-f. (g): For near-UV CD analysis, the mean residue molar ellipticities at 280 nm ([θ]280) were plotted as a function of temperature. (h): For fluorescence measurements, the protein sample was excited at 290 nm and the maximum emission wavelengths (λmax) were plotted as a function of temperature. (i): For far-UV CD analysis, the mean residue molar ellipticities at 220 nm ([θ]220) were plotted as a function of temperature.
Figure 4
Figure 4
Irreversible denaturation of CTA1. (a-c): Near-UV CD (a), tryptophan fluorescence (b), and far-UV CD (c) were used to monitor the refolding of denatured CTA1. Data were collected for a reduced CTA1/CTA2 heterodimer that was heated from 18°C to 65°C (filled circles) and then cooled from 65°C to 18°C (open circles). Measurements were conducted near-simultaneously on the same sample after equilibration at each temperature for 4 minutes. Protein concentration was 34 µg /ml in 20 mM Na-phosphate (pH 7.0) containing 150 mM NaCl and 10 mM β-ME. The simulated curves for reduced CTA1 from Figures 3(a), 3(b), and 3(c) were used to fit the experimental data in the corresponding panels of this Figure.
Figure 5
Figure 5
CTA1 protease sensitivity. Samples of a purified CTA1/CTA2 heterodimer were placed in 20 mM Na-phosphate buffer (pH 7.0) with 10 mM β-ME and incubated for 1 hour at 4°C (lane 1), 25°C (lane 2), 33°C (lane 3), 37°C (lane 4), or 41°C (lane 5). All samples of reduced toxin were then shifted to 4°C and exposed to thermolysin for 1 hour. Thermolysin without toxin was run in lane 6; a thermolysin-treated, disulfide-linked CTA1/CTA2 heterodimer (no β-ME present in the buffer) that was pre-incubated at 37°C was run in lane 7. Samples were visualized by SDS-PAGE and Coomassie staining.
Figure 6
Figure 6
In vitro degradation of CTA1 by the 20S proteasome. The reduced CTA1/CTA2 heterodimer (rCTA1), the disulfide-linked CTA1/CTA2 heterodimer (CTA1 + CTA2), α-casein, and the CTB pentamer were incubated at 37°C with the 20S proteasome. Samples taken after 0 hours (lane 1), 3 hours (lane 2), 9 hours (lane 3), or 20 hours (lane 4) of incubation were visualized by SDS-PAGE and Coomassie staining. The CTA1/CTA2 heterodimers were incubated with 10 nM of the 20S proteasome; α-casein and CTB were incubated with 100 nM of the 20S proteasome and 3 mM ATP.
Figure 7
Figure 7
Degradation and activity of transfected CTA1. (a-b): Transfected CHO cells co-expressing CTA1 with either an empty vector (+ Vector), wild-type ubiquitin (+ Ub), or dominant negative K48R ubiquitin (+ dn Ub) were radiolabeled and chased for 0-4 hours. Anti-CTA immunoprecipitates from cell extracts generated after each indicated chase interval were visualized (a) and quantified (b) by SDS-PAGE with PhosphorImager analysis. Graphs represent the means ± standard errors of the means of at least four independent experiments. (c): Transfected CHO cells expressing CTA1 were incubated in the absence or presence of 100 µM ALLN and processed as described above. One of four representative experiments is shown. (d): CHO cells transfected with the CTA1 construct were immediately chased for 2, 4, or 8 hours in the absence or presence of 100 µM ALLN. Cell extracts were then generated and assayed for cAMP content. Background-subtracted cAMP levels from five experiments with triplicate samples (means ± standard errors of the means) are shown.
Figure 8
Figure 8
Effect of ARF6 on CTA1 proteolysis. (a-b): Samples of a purified CTA1/CTA2 heterodimer were placed in 20 mM Na-phosphate buffer (pH 7.0) with 10 mM β-ME. The toxins were also co-incubated with no additions (CTA1), ARF6 (CTA1 + ARF6), or ARF6 and GTP (CTA1 + ARF6/GTP). (a): After a 1 hour incubation at the indicated temperatures, the samples were shifted to 4°C and exposed to thermolysin for 1 hour. CTA1, ARF6, and the ARF6 proteolytic fragment (*ARF6) were then visualized by SDS-PAGE and Coomassie staining. (b): Samples were incubated with 3 mM ATP and 100 nM of the 20S proteasome for 0, 3, 9, or 20 hours of incubation at 37°C. Aliquots taken after these intervals were visualized by SDS-PAGE and Coomassie staining.
Figure 9
Figure 9
ARF6 interactions with CTA1. (a-d): Toxin-protein interactions at 37°C were monitored by SPR. High values for the Micro Refractive Index Unit (RIU) denote strong toxin-protein interactions. A decrease in Micro RIU values occurred when the CTA1-interacting protein was removed from the perfusion buffer (indicated by the arrows). (a): CTA1-His6 interactions with anti-CTA or anti-CTB antibodies. (b): CTA1-His6 interactions with ARF6 in the absence or presence of GTP. (c): CTA11-168•His6 interactions with ARF6 in the absence or presence of GTP. (d): Interactions between the CT holotoxin and anti-CTA antibodies, anti-CTB antibodies, ARF6, or ARF6 in the presence of GTP. The dramatic signal obtained with the anti-CTB antibody was likely due to the pentameric structure of the CTB subunit and the corresponding increase in antibody binding sites compared to the CTA subunit.

References

    1. Spangler BD. Structure and function of cholera toxin and the related Escherichia coli heat-labile enterotoxin. Microbiol Rev. 1992;56:622–647. - PMC - PubMed
    1. De Haan L, Hirst TR. Cholera toxin: a paradigm for multi-functional engagement of cellular mechanisms (Review) Mol Membr Biol. 2004;21:77–92. - PubMed
    1. Majoul I, Ferrari D, Soling HD. Reduction of protein disulfide bonds in an oxidizing environment. The disulfide bridge of cholera toxin A-subunit is reduced in the endoplasmic reticulum. FEBS Lett. 1997;401:104–108. - PubMed
    1. Lencer WI, Tsai B. The intracellular voyage of cholera toxin: going retro. Trends Biochem Sci. 2003;28:639–645. - PubMed
    1. Orlandi PA. Protein-disulfide isomerase-mediated reduction of the A subunit of cholera toxin in a human intestinal cell line. J Biol Chem. 1997;272:4591–4599. - PubMed

Publication types

LinkOut - more resources