

Model of hidden heterogeneity in longitudinal data
- PMID: 17977568
- PMCID: PMC2268646
- DOI: 10.1016/j.tpb.2007.09.001
Model of hidden heterogeneity in longitudinal data
Abstract
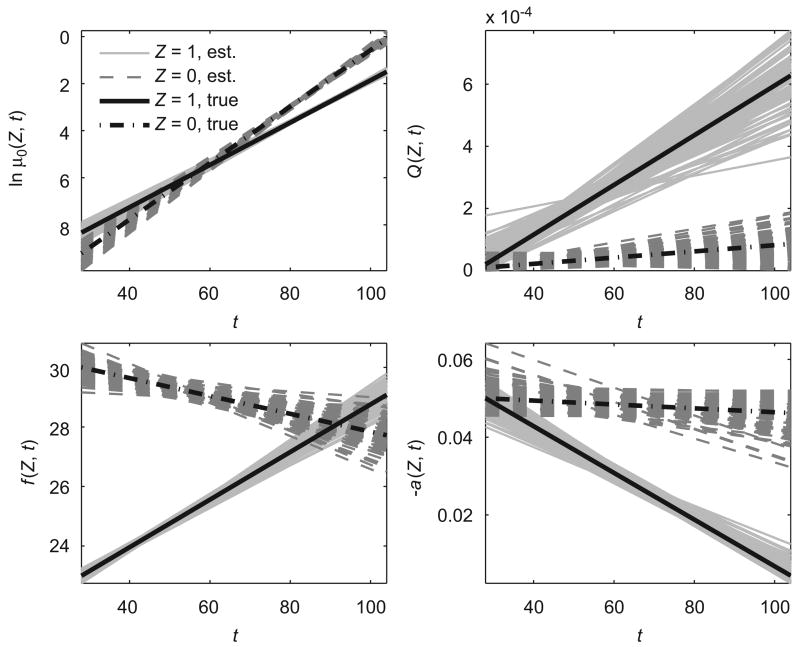
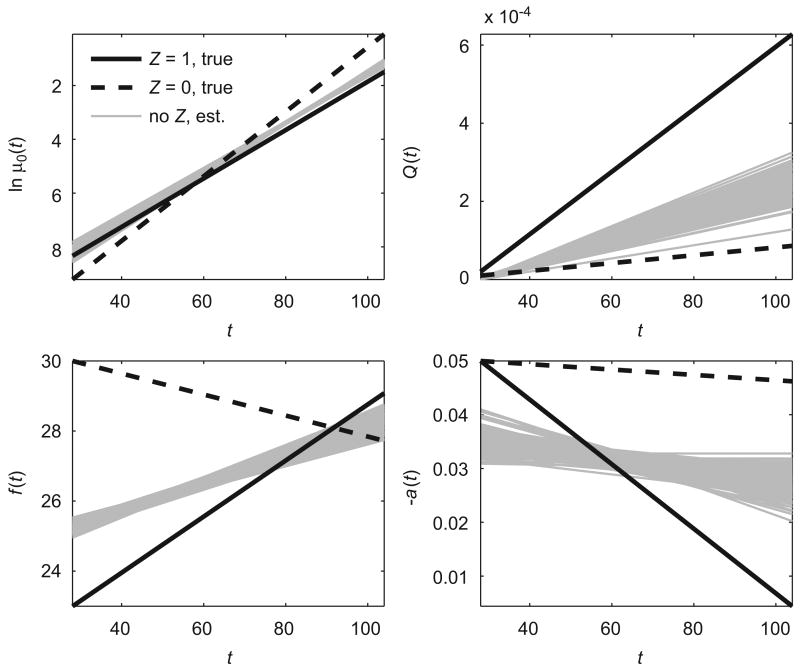
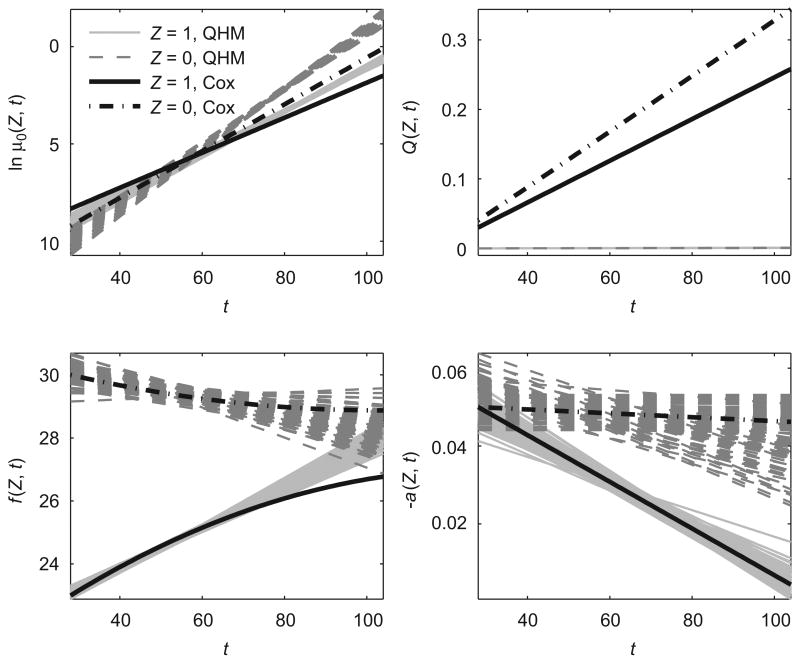
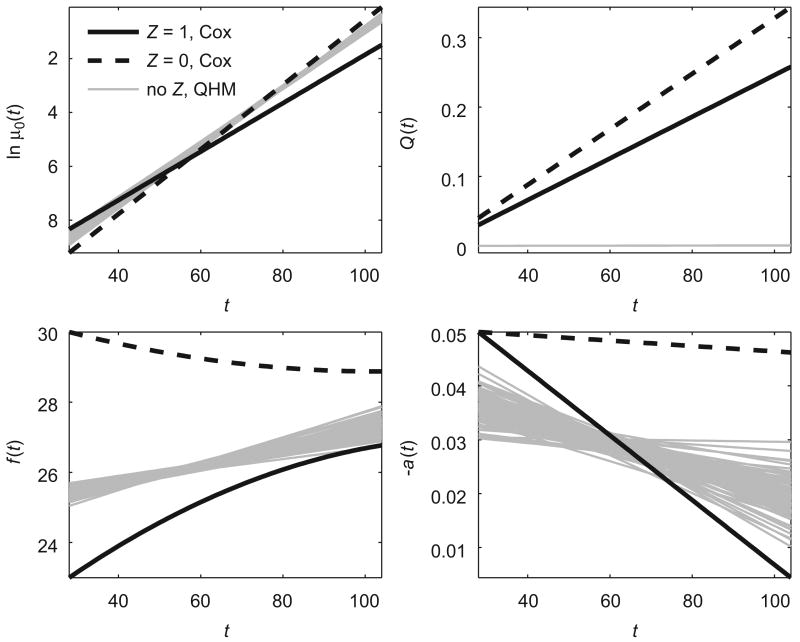
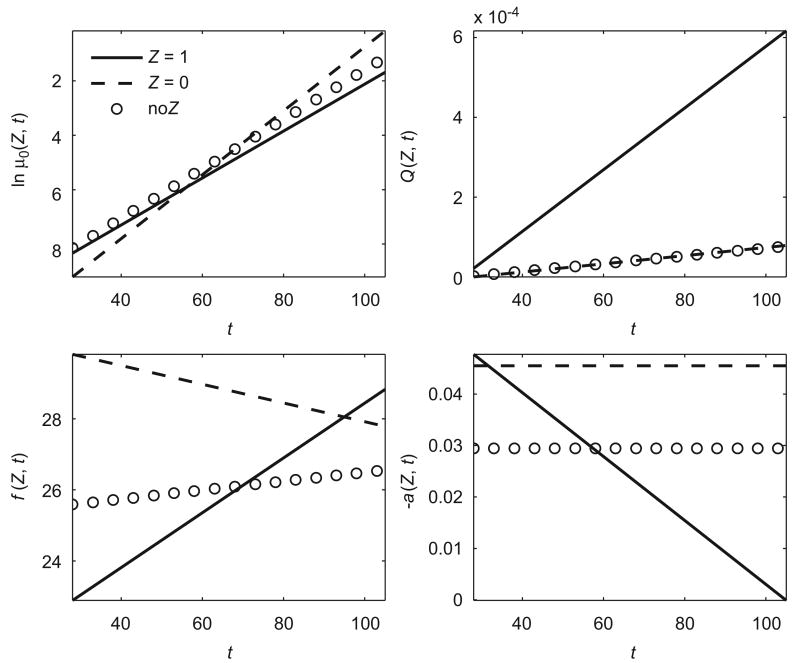
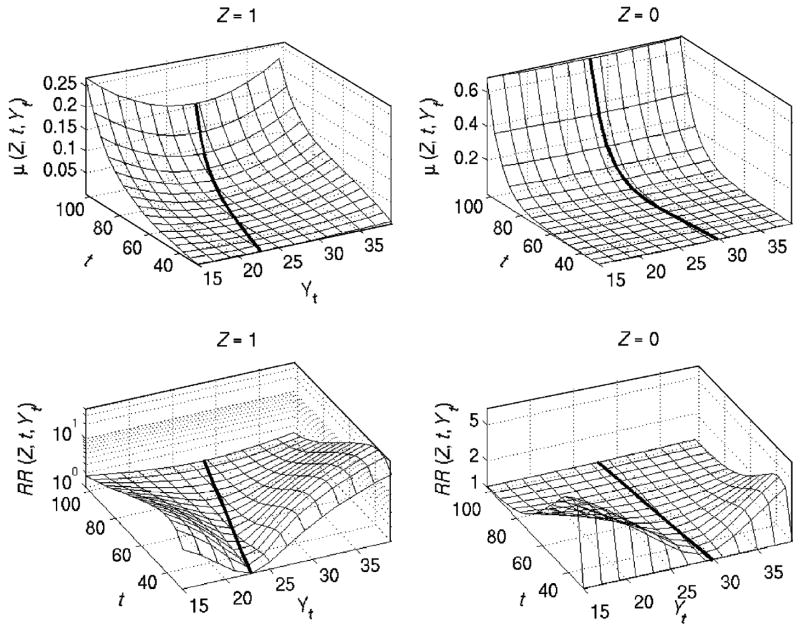
Variables measured in longitudinal studies of aging and longevity do not exhaust the list of all factors affecting health and mortality transitions. Unobserved factors generate hidden variability in susceptibility to diseases and death in populations and in age trajectories of longitudinally measured indices. Effects of such heterogeneity can be manifested not only in observed hazard rates but also in average trajectories of measured indices. Although effects of hidden heterogeneity on observed mortality rates are widely discussed, their role in forming age patterns of other aging-related characteristics (average trajectories of physiological state, stress resistance, etc.) is less clear. We propose a model of hidden heterogeneity to analyze its effects in longitudinal data. The approach takes the presence of hidden heterogeneity into account and incorporates several major concepts currently developing in aging research (allostatic load, aging-associated decline in adaptive capacity and stress-resistance, age-dependent physiological norms). Simulation experiments confirm identifiability of model's parameters.
Figures
Similar articles
-
Genetic model for longitudinal studies of aging, health, and longevity and its potential application to incomplete data.J Theor Biol. 2009 May 7;258(1):103-11. doi: 10.1016/j.jtbi.2009.01.023. Epub 2009 Feb 4. J Theor Biol. 2009. PMID: 19490866 Free PMC article.
-
How Genes Modulate Patterns of Aging-Related Changes on the Way to 100: Biodemographic Models and Methods in Genetic Analyses of Longitudinal Data.N Am Actuar J. 2016;20(3):201-232. doi: 10.1080/10920277.2016.1178588. Epub 2016 Jun 22. N Am Actuar J. 2016. PMID: 27773987 Free PMC article.
-
Stochastic model for analysis of longitudinal data on aging and mortality.Math Biosci. 2007 Aug;208(2):538-51. doi: 10.1016/j.mbs.2006.11.006. Epub 2006 Dec 5. Math Biosci. 2007. PMID: 17300818 Free PMC article.
-
Folic acid supplementation and malaria susceptibility and severity among people taking antifolate antimalarial drugs in endemic areas.Cochrane Database Syst Rev. 2022 Feb 1;2(2022):CD014217. doi: 10.1002/14651858.CD014217. Cochrane Database Syst Rev. 2022. PMID: 36321557 Free PMC article.
-
How the effects of aging and stresses of life are integrated in mortality rates: insights for genetic studies of human health and longevity.Biogerontology. 2016 Feb;17(1):89-107. doi: 10.1007/s10522-015-9594-8. Epub 2015 Aug 18. Biogerontology. 2016. PMID: 26280653 Free PMC article. Review.
Cited by
-
Cumulative deficits and physiological indices as predictors of mortality and long life.J Gerontol A Biol Sci Med Sci. 2008 Oct;63(10):1053-9. doi: 10.1093/gerona/63.10.1053. J Gerontol A Biol Sci Med Sci. 2008. PMID: 18948555 Free PMC article.
-
A genetic stochastic process model for genome-wide joint analysis of biomarker dynamics and disease susceptibility with longitudinal data.Genet Epidemiol. 2017 Nov;41(7):620-635. doi: 10.1002/gepi.22058. Epub 2017 Jun 21. Genet Epidemiol. 2017. PMID: 28636232 Free PMC article.
-
The quadratic hazard model for analyzing longitudinal data on aging, health, and the life span.Phys Life Rev. 2012 Jun;9(2):177-88; discussion 195-7. doi: 10.1016/j.plrev.2012.05.002. Epub 2012 May 17. Phys Life Rev. 2012. PMID: 22633776 Free PMC article.
-
Joint Analyses of Longitudinal and Time-to-Event Data in Research on Aging: Implications for Predicting Health and Survival.Front Public Health. 2014 Nov 6;2:228. doi: 10.3389/fpubh.2014.00228. eCollection 2014. Front Public Health. 2014. PMID: 25414844 Free PMC article. Review.
-
Modeling hematopoietic system response caused by chronic exposure to ionizing radiation.Radiat Environ Biophys. 2011 May;50(2):299-311. doi: 10.1007/s00411-011-0351-3. Epub 2011 Jan 23. Radiat Environ Biophys. 2011. PMID: 21259022 Free PMC article.
References
-
- Chobanian AV, Bakris GL, Black HR, Cushman WC, Green LA, Izzo JL, Jr, Jones DW, Materson BJ, Oparil S, Wright JT, Jr, Roccella EJ. Joint National Committee on Prevention, Detection, Evaluation, and Treatment of High Blood Pressure. National Heart, Lung, and Blood Institute; National High Blood Pressure Education Program Coordinating Committee Seventh report of the Joint National Committee on Prevention, Detection, Evaluation, and Treatment of High Blood Pressure Hypertension. 2003;42(6):1206–1252. - PubMed
-
- Dawber TR, Kannel WB. An epidemiologic study of heart disease: the Framingham Study. Nutr Rev. 1958;16:1–4. - PubMed
-
- Elbers C, Ridder G. True and spurious duration dependence: the identifiability of the proportional hazards model. Rev Econ Stud. 1982;49:403–409.
-
- Lund J, Tedesco P, Duke K, Wang J, Kim SK, Johnson TE. Transcriptional profile of aging in C. elegans. Curr Biol. 2002;12(18):1566–1573. - PubMed
-
- Manton KG, Yashin AI. Odense Monograph on Population Aging No. 7. Odense University Press; Odense, Denmark: 2000. Mechanisms of Aging and Mortality: A Search for New Paradigms.
Publication types
MeSH terms
Grants and funding
LinkOut - more resources
Full Text Sources
