Review
. 2007 Oct 31;27(44):11820-31.
doi: 10.1523/JNEUROSCI.4164-07.2007.

Disparity channels in early vision

Affiliations
Review

Disparity channels in early vision

Anna W Roe et al. J Neurosci. .

Erratum in

  • J Neurosci. 2007 Dec 26;27(52):14525

Abstract

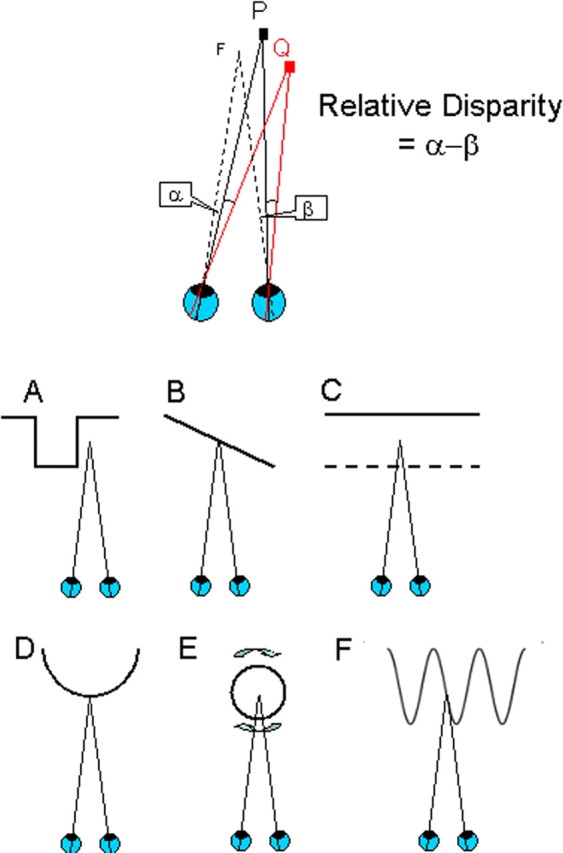
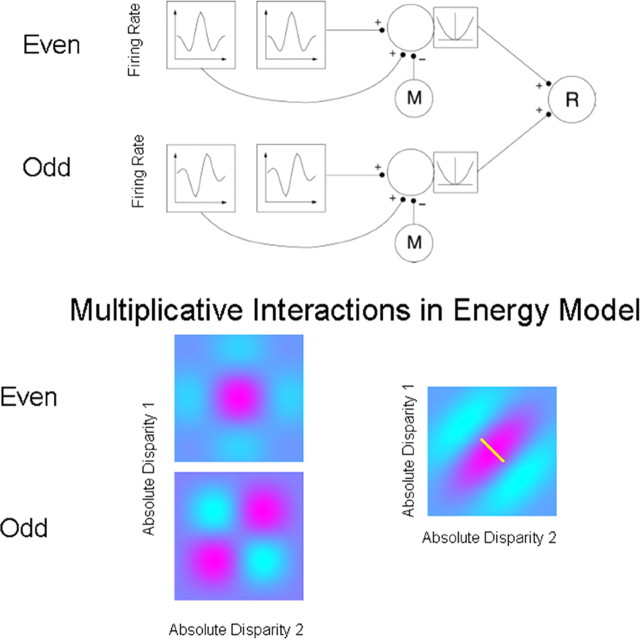
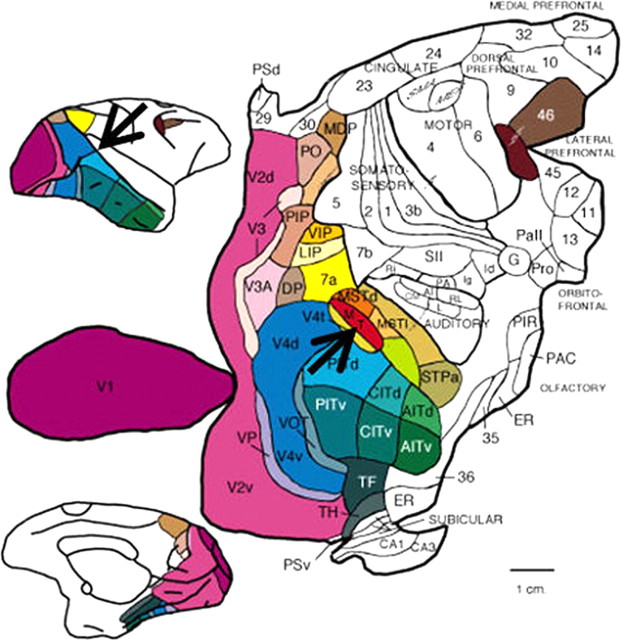
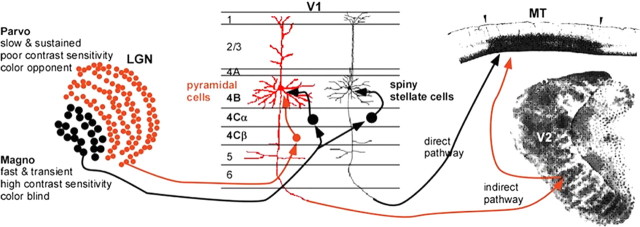
The past decade has seen a dramatic increase in our knowledge of the neural basis of stereopsis. New cortical areas have been found to represent binocular disparities, new representations of disparity information (e.g., relative disparity signals) have been uncovered, the first topographic maps of disparity have been measured, and the first causal links between neural activity and depth perception have been established. Equally exciting is the finding that training and experience affects how signals are channeled through different brain areas, a flexibility that may be crucial for learning, plasticity, and recovery of function. The collective efforts of several laboratories have established stereo vision as one of the most productive model systems for elucidating the neural basis of perception. Much remains to be learned about how the disparity signals that are initially encoded in primary visual cortex are routed to and processed by extrastriate areas to mediate the diverse capacities of three-dimensional vision that enhance our daily experience of the world.


Figures

Figure 1.
Figure 1.
Absolute and relative disparity. Top, Suppose that both eyes are looking at a the fixation point F (lines of sight toward F depart from fovea of each eye). When visual features (P or Q) are at a different depth, their images fall at different positions on the left and right retinas with respect to the foveas. To look at P (or Q) directly, the eyes have to rotate by different angles. This difference of angles is called the absolute disparity of the feature P (or Q). The relationship between P and Q can be captured more directly by considering their relative disparity. Regardless of where the eyes are pointing, the angular separation of P and Q as seen by the left eye (α) is smaller than the separation seen by the right eye (β). The difference in angular separations (β − α) is called the relative disparity between P and Q. The relative disparity between two visual targets is a sensitive way of measuring the spatial relationship between them in three-dimensional space. A–F, There are multiple possibilities for choosing two visible features for creating sensitivity to relative disparity. The bottom row shows the depth profiles of some stimuli that all have the same relative disparity. All have been used to probe the response of single neurons or fMRI studies signals to relative disparity. Ventral visual areas appear to be more specialized for the processing of 3D shape (configurations A and D), whereas the dorsal areas are more specialized for the processing of extended surfaces (configuration B) and their segregation into depth planes (configuration C, transparent depth planes, and configuration E, rotating transparent cylinders). Configuration F shows a sinusoidal variation of depth as a function of spatial position. Adapted with permission from Parker (2007).
Figure 2.
Figure 2.
Adaptation of the disparity energy model to compute relative disparity. Top, Inputs whose firing rates are selective for absolute disparity, similar to those found in V1, are summed and squared. Relative disparity is computed by applying a second-level disparity energy computation to the outputs of the two V1-like receptive field. Each first-level disparity energy model computes absolute disparity. Such responses are summed, squared, and pooled to produce a consistent selectivity for relative disparity (neuron R). One aspect of this implementation is that the output from monocular filters (M) is subtracted from the neuronal signal before the squaring operation. If this monocular term is not subtracted, the response is more strongly influenced by absolute disparity. (Reproduced with permission from Thomas et al., 2002, their Fig. 5.) Bottom, The spatial structure underlying the model. This shows the combinations arising from two pairs of neurons sensitive to absolute disparity. A pair of neurons tuned with even symmetry for absolute disparity are summed together with a pair of neurons tuned with odd symmetry for absolute disparity. On each plot, relative disparity is a constant difference between two absolute disparities, indicated by the small white line on the far right plot. The interactions provided by the energy model provide for a consistent selectivity to relative disparity over a range of different absolute disparities. This local invariance of response is an important new property that provides for a context-dependent response to combinations of absolute and relative disparity.
Figure 3.
Figure 3.
Two-dimensional map of macaque visual areas. Cerebral cortex from macaque monkey brain has been flattened and color-coded. Top inset, Lateral view of brain; bottom inset, medial view of brain. Black arrows indicate the location of area MT. [Modified with permission from Felleman and Van Essen (1991), their Fig. 2.] Abbreviations are from Felleman and Van Essen (1991).
Figure 4.
Figure 4.
Two routes to visual area MT: direct (black) and indirect (red). Information from “magnocellular” (Magno, black dots in LGN) and “parvocellular” (Parvo, red dots in LGN) processing streams converge in striate cortex (V1). M cells project to layer 4Cα of V1, which projects to both pyramidal (red) and spiny stellate (black) cells of layer 4B. The P cells project to layer 4Cβ and then to the pyramidal cells (but not the spiny stellate cells) of layer 4B. The spiny stellate cells send their M-dominated signals directly to MT, which is distinguished from surrounding areas by its heavy myelination. The pyramidal cells relay their presumably mixed M and P signals to MT indirectly via either the thick stripes of V2, revealed by staining for cytochrome oxidase, or V3 (data not shown). [Modified with permission from Born (2001).]
Figure 5.
Figure 5.
Integration of direction- and disparity-based maps in MT. a, Columnar model of direction and disparity organization of MT. The top surface of this slab corresponds to the surface of MT, and height of the slab corresponds to the thickness of the cortex. Arrows denote the preferred direction of motion of MT neurons in each direction column. Preferred disparity is color-coded, with green representing near disparities, red representing far disparities, and yellow indicating zero disparity. b, Orderly relationship between the disparity and direction maps. Comparison of signed rates of change in preferred direction and disparity. Triangles and circles denote data from monkeys S and P, respectively. The solid line is the best linear fit (linear regression). Positive values on the y-axis correspond to preferred direction rotating counterclockwise; positive values on the x-axis correspond to preferred disparity changing from near to far. [DeAngelis and Newsome (1999), their Figs. 17, 18, reproduced with permission.]
Figure 6.
Figure 6.
Disparity representation in V2. A, Top, Optical image of ocular dominance (od) map in macaque monkey visual cortex reveals border between V1 and V2 (indicated at left). Bottom, Binocular (binoc) minus monocular map. As shown by previous studies, regions more responsive to binocular than monocular activation of V2 correspond to locations of cytochrome oxidase thick stripes (Ts'o et al., 2001). B, Near-to-far topography within V2 thick stripe. Summary map of near (red), zero (green), and far (blue) domains imaged in a thick stripe of V2 [modified with permission from Chen et al.(2006)]. Scale bars, 1 mm.
Figure 7.
Figure 7.
Data from a “planar opponent” neuron. The schematics across the top show the stimuli. a, A single random-dot pattern moving in the preferred direction (in this case, three o'clock); b, two superimposed patterns moving in opposite directions (transparent stimulus); c, two adjacent patterns moving in opposite directions (motion border stimulus). Filled circles represent dots moving in the preferred direction; open circles represent the antipreferred direction. [Bradley et al. (1995), their Fig. 1, reproduced with permission.]
Figure 8.
Figure 8.
Neural correlates of 3D structure-from-motion. a, Visual stimuli used in the experiments; b, relationship between spike rates of MT neurons and the monkeys' perceptual decisions on ambiguous trials. Distribution of choice probabilities from 93 MT neurons selective for direction of disparity-defined rotating cylinder. Filled bars, Neurons with a choice probability significantly different from 0.5 (40 of 93 neurons). [Dodd et al. (2001), their Figs. 1, 5, reproduced with permission.] −ve, Negative; +ve, positive; CW, clockwise; CCW, counterclockwise.

References

    1. Albright TD, Desimone R, Gross CG. Columnar organization of directionally selective cells in visual area MT of the macaque. J Neurophysiol. 1984;51:16–31. - PubMed
    1. Archie KA, Mel BW. A model for intradendritic computation of binocular disparity. Nat Neurosci. 2000;3:54–63. - PubMed
    1. Bakin JS, Nakayama K, Gilbert CD. Visual responses in monkey areas V1 and V2 to three-dimensional surface configurations. J Neurosci. 2000;20:8188–8198. - PMC - PubMed
    1. Barlow HB, Blakemore C, Pettigrew JD. The neural mechanism of binocular depth discrimination. J Physiol (Lond) 1967;193:327–342. - PMC - PubMed
    1. Bishop PO, Pettigrew JD. Neural mechanisms of binocular vision. Vision Res. 1986;26:1587–1600. - PubMed

Publication types

LinkOut - more resources