. 2007 Oct 31;27(44):11869-76.
doi: 10.1523/JNEUROSCI.3647-07.2007.

Diffusion tensor imaging reliably detects experimental traumatic axonal injury and indicates approximate time of injury

Affiliations

Diffusion tensor imaging reliably detects experimental traumatic axonal injury and indicates approximate time of injury

Christine L Mac Donald et al. J Neurosci. .

Abstract

Traumatic axonal injury (TAI) may contribute greatly to neurological impairments after traumatic brain injury, but it is difficult to assess with conventional imaging. We quantitatively compared diffusion tensor imaging (DTI) signal abnormalities with histological and electron microscopic characteristics of pericontusional TAI in a mouse model. Two DTI parameters, relative anisotropy and axial diffusivity, were significantly reduced 6 h to 4 d after trauma, corresponding to relatively isolated axonal injury. One to 4 weeks after trauma, relative anisotropy remained decreased, whereas axial diffusivity "pseudo-normalized" and radial diffusivity increased. These changes corresponded to demyelination, edema, and persistent axonal injury. At every time point, DTI was more sensitive to injury than conventional magnetic resonance imaging, and relative anisotropy distinguished injured from control mice with no overlap between groups. Remarkably, DTI changes strongly predicted the approximate time since trauma. These results provide an important validation of DTI for pericontusional TAI and suggest novel clinical and forensic applications.


Figures

Figure 1.
Figure 1.
Pericontusional white matter histopathology after experimental controlled cortical impact TBI in mice. APP (A–C), neurofilament light chain (NF-L; D–F), GFAP (G–I), and myelin basic protein (MBP; J–L) immunohistochemistry is shown. A, D, G, Uninjured white matter shows no APP, NF-L, or GFAP staining in the corpus callosum and external capsule. B, E, Acutely after injury (24 h), there were numerous APP- or neurofilament-stained axonal varicosities. C, F, At a subacute time point (7 d), both APP- and neurofilament-stained axonal varicosities were still detectible, although there were fewer visible than at acute time points. H, I, GFAP-immunoreactive astrocytes were present at both time points, although there was a marked increase in the number of these cells and intensity of staining at 7 d. J, MBP immunoreactivity was uniform throughout the uninjured white matter. K, Acutely after injury, MBP immunoreactivity appeared similar to control. L, Subacutely, MBP immunoreactivity was still strongly present, although there were changes in the character of the staining; specifically, small spheroidal, immunoreactive structures (white arrows) appeared within otherwise apparently unremarkable white matter.
Figure 2.
Figure 2.
Stereological quantification of axonal injury and gliosis after TBI. A, Estimated numbers of APP-stained axonal varicosities per cubic millimeter as a function of time after injury. There was a statistically significant increase in APP-stained axonal varicosities indicative of axonal injury at all time points after trauma, with the greatest increases at the acute time points (4–6 h, 24 h, and 4 d). B, Estimated numbers of neurofilament light chain (NR4 antibody)-stained axonal varicosities per cubic millimeter as a function of time after injury. Again, there was a statistically significant increase in neurofilament light chain-stained immunoreactive axonal varicosities at all time points after injury, and these changes were more marked at the acute time points than at the subacute time points. C, Estimated numbers of GFAP-stained immunoreactive astrocytes per cubic millimeter as a function time after injury. Compared with control, there was a significant elevation at all time points after injury; the numbers of immunoreactive astrocytes rose markedly at 4 d after injury and remained elevated at 7 d and 1 month. Error bars represent SDs. n = 4–6 mice per group. Statistical significance was determined with a Student's t test for independent samples compared with control.
Figure 3.
Figure 3.
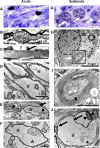
Ultrastructural changes at acute (A–F) and subacute (G–J) time points after TBI. A, APP immunohistochemistry in a semithin section counterstained with methylene blue/azur. Regions containing APP-stained axonal varicosities (white arrows) were used to guide EM analysis. B, Nodal segment of an injured axon in the corpus callosum demonstrating organelle compaction (white arrow) within a varicosity. Note the generally preserved myelin sheathes. An area of focal myelin loss with damaged axonal cytoskeletal structures (black arrow) adjacent to the varicosity is shown. C, Axonal segment with neurofilament compaction and focal myelin loss (black arrow). D, Longitudinal section through a swollen segment of a myelinated axon in the external capsule, rostral to the epicenter of injury, with breakdown of cytoskeletal filaments and lack of microtubules (asterisks). E, Two connected varicosities with distorted mitochondria (arrowheads) and disrupted cytoskeletal structures (asterisk) in a myelinated axon. Note an adjacent segment of an intact unmyelinated axon (black arrow). F, Cross section of a myelinated axon from a severely injured region deformed by edema (asterisks). G, Semithin section stained with methylene blue/azur from a region of the subacutely injured corpus callosum invaded by phagocytic cells (white arrows). H, Macrophage in the corpus callosum showing intracytoplasmic vacuoles (asterisks) and a degenerating phagocytosed segment of a markedly swollen, myelinated axon (white arrow). I, High-magnification image of the degenerating axon phagocytosed by the macrophage in H (white arrow). J, Advanced stage of axoplasmic degeneration (arrowheads) in a myelinated axon in the external capsule showing myelin thinning (black arrows) and marked intracellular edema (asterisk).
Figure 4.
Figure 4.
DTI signal characteristics at acute and subacute time points after TBI. The ROI is outlined in red, and the anatomical boundaries used to define the ROI are marked in blue. At this level, the medial boundary was the midline, bisecting the ventral hippocampal commissure (vhc), and the inferolateral boundary was defined by a horizontal line through the inferior edge of the fimbria (fi). Lighter grayscale shading indicates increased anisotropy or greater diffusivity. A, AD was elevated in the uninjured corpus callosum and external capsule compared with surrounding cortical and subcortical gray matter. B, Acutely after TBI, AD was reduced within the white matter. Shown is a pericontusional region rostral to the epicenter of the injury [bregma, −0.46 mm (Franklin and Paxinos, 1997)]. C, Subacutely, AD appeared to normalize, although parts of the overlying cortex had an elevated signal. D, RD was reduced in the uninjured white matter relative to gray matter. Ventricles and periventricular regions appear bright on this image. E, Acutely after TBI, RD was little changed in the white matter. F, Subacutely, RD was markedly elevated in the white matter, and portions of the overlying cortex also showed high signal. G, RA was markedly elevated in uninjured white matter relative to gray matter. H, After acute injury, RA in white matter was diminished dramatically. I, Subacutely, RA was still strongly reduced. Gray matter regions showed low RA in control and at all time points after injury. Examples are shown for illustrative purposes and are not necessarily from the same mouse.
Figure 5.
Figure 5.
Quantitative analysis of DTI parameters after TBI. A, Changes in average AD over time across the complete ROI. AD was significantly reduced at the acute time points (4–6 h, 24 h, 4 d) after injury and increased (pseudo-normalized) at the subacute time points (1 week, 1 month). Values at pooled acute time points were significantly different from those at pooled subacute times. B, Changes in average RD over time. RD remained within the normal range until 1 week after TBI, when it became significantly elevated. Again, the values at subacute time points were significantly different from those at the acute time points. C, Changes in RA over time. Highly significant reductions in RA were noted at all acute and subacute time points. D, Changes in mean diffusivity over time. Although there were not consistent changes with respect to control, acute and subacute injuries differed markedly from each other. n = 4–6 mice per group. Statistical significance was determined with a Student's t test for independent samples. Error bars represent SDs.
Figure 6.
Figure 6.
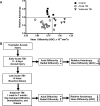
Discriminative value of DTI. A, Scatterplot of RA versus mean diffusivity for control, acute, and subacute time points. There was no overlap between the control and injured groups in terms of RA, and there was very little overlap between the acute and subacute injury groups in terms of mean diffusivity. B, Schematic of changes after traumatic axonal injury over time and the corresponding DTI characteristics. During the early acute phase after TBI (4–6 h, 24 h), axonal injury is present histologically, and AD is reduced. This in turn causes a reduction in RA and a slight reduction in mean diffusivity. By 4 d after injury, reactive gliosis is present histologically, but there are no accompanying DTI changes. At 1 week to 1 month after injury, there is significant macrophage infiltration, demyelination, and edema. These changes lead to an elevation in both axial diffusivity and RD, which in turn causes a reduction in RA and an increase in mean diffusivity.

References

    1. Adams H, Mitchell DE, Graham DI, Doyle D. Diffuse brain damage of immediate impact type. Its relationship to “primary brain-stem damage” in head injury. Brain. 1977;100:489–502. - PubMed
    1. Adams JH, Graham DI, Murray LS, Scott G. Diffuse axonal injury due to nonmissile head injury in humans: an analysis of 45 cases. Ann Neurol. 1982;12:557–563. - PubMed
    1. Adams JH, Doyle D, Ford I, Gennarelli TA, Graham DI, McLellan DR. Diffuse axonal injury in head injury: definition, diagnosis and grading. Histopathology. 1989;15:49–59. - PubMed
    1. Albensi BC, Knoblach SM, Chew BG, O'Reilly MP, Faden AI, Pekar JJ. Diffusion and high resolution MRI of traumatic brain injury in rats: time course and correlation with histology. Exp Neurol. 2000;162:61–72. - PubMed
    1. Alsop DC, Murai H, Detre JA, McIntosh TK, Smith DH. Detection of acute pathologic changes following experimental traumatic brain injury using diffusion-weighted magnetic resonance imaging. J Neurotrauma. 1996;13:515–521. - PubMed

Publication types

Substances

LinkOut - more resources