. 2007 Oct 31;27(44):11912-24.
doi: 10.1523/JNEUROSCI.3522-07.2007.

Evidence accumulation and the moment of recognition: dissociating perceptual recognition processes using fMRI

Affiliations

Evidence accumulation and the moment of recognition: dissociating perceptual recognition processes using fMRI

Elisabeth J Ploran et al. J Neurosci. .

Abstract

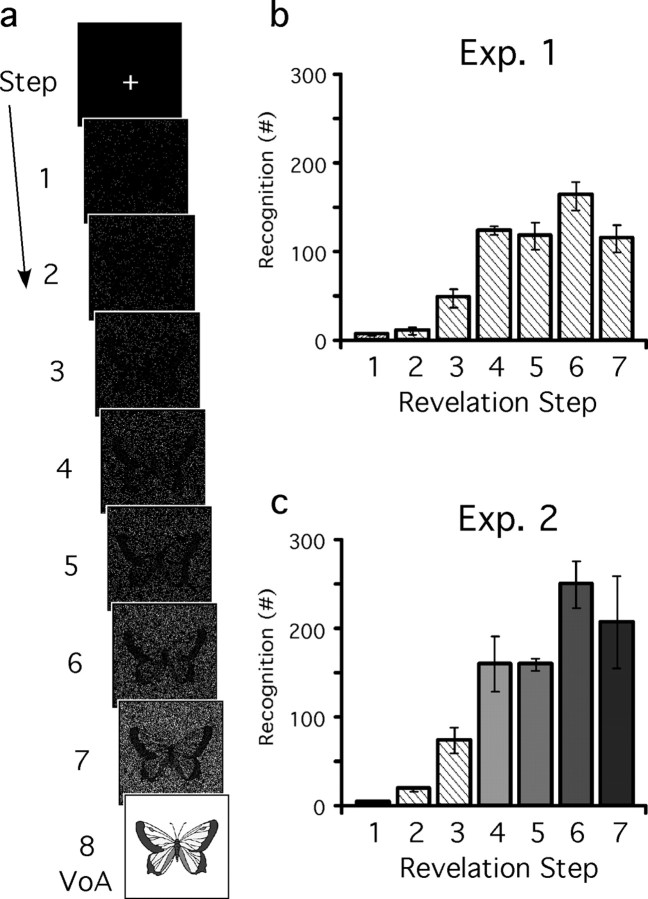
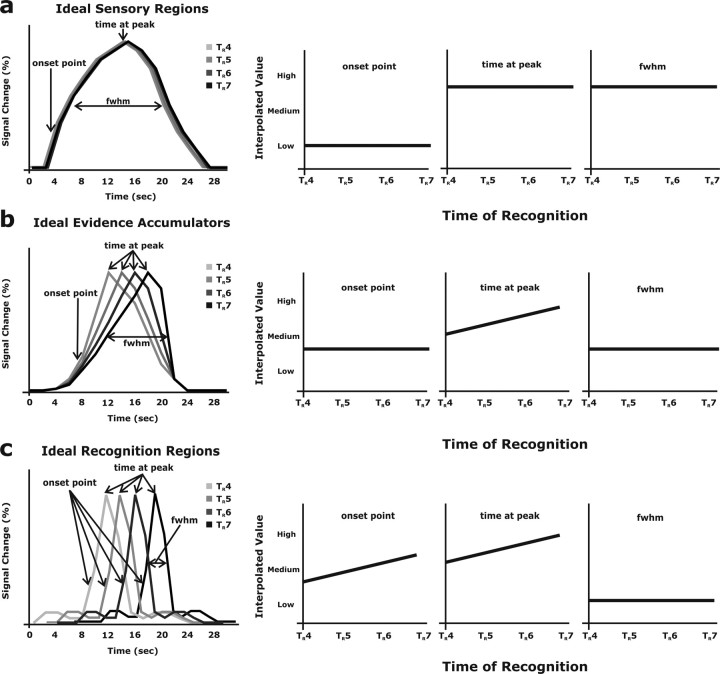
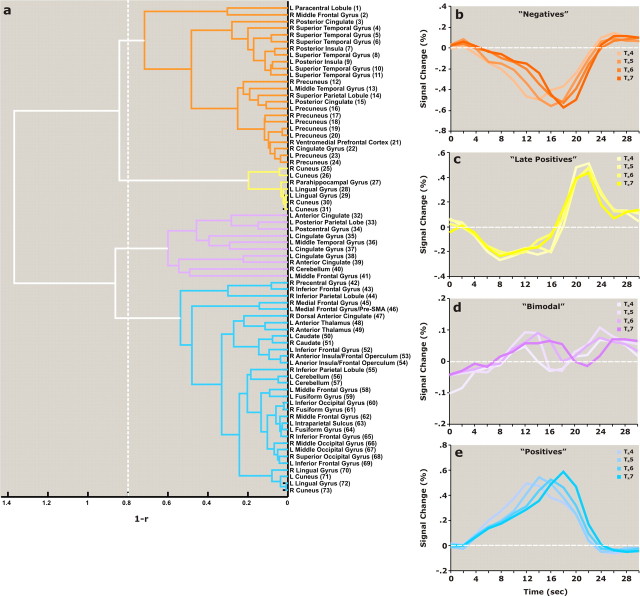
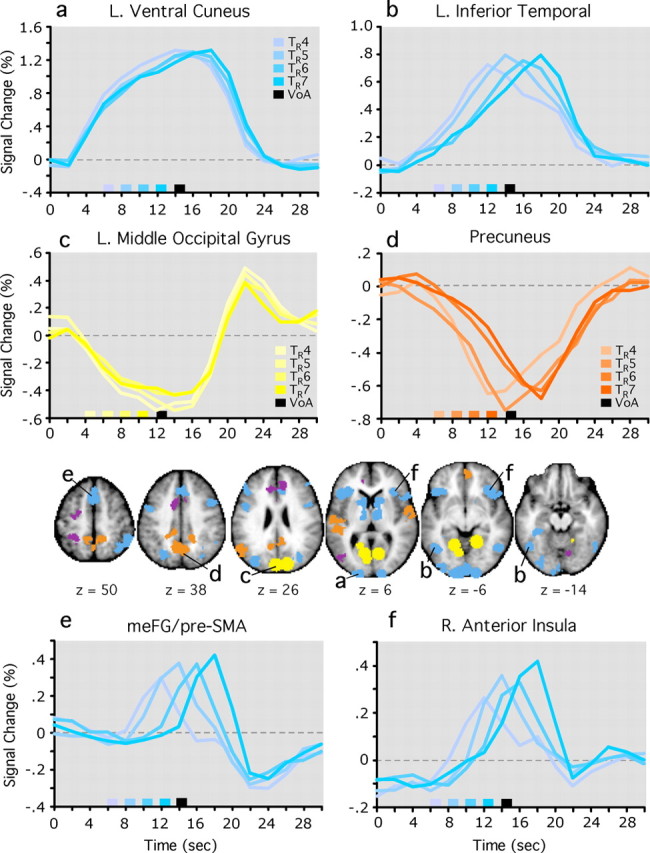
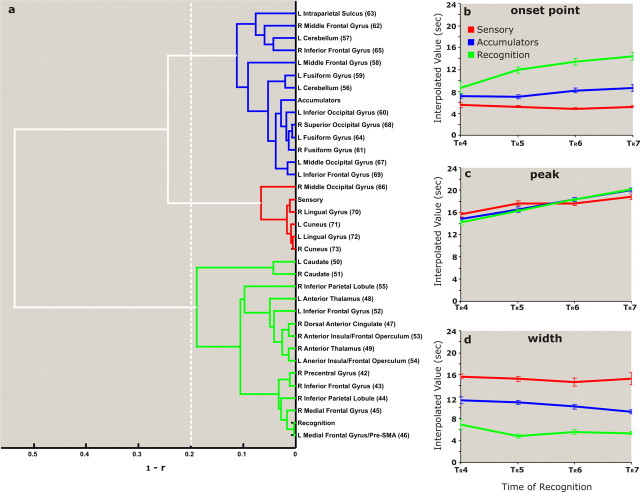
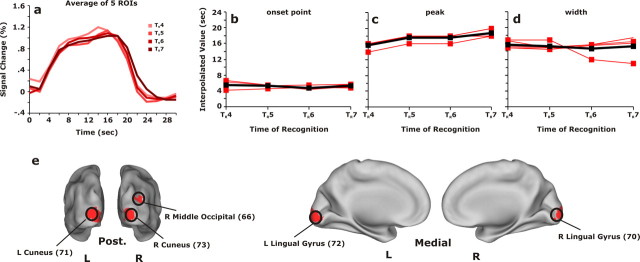
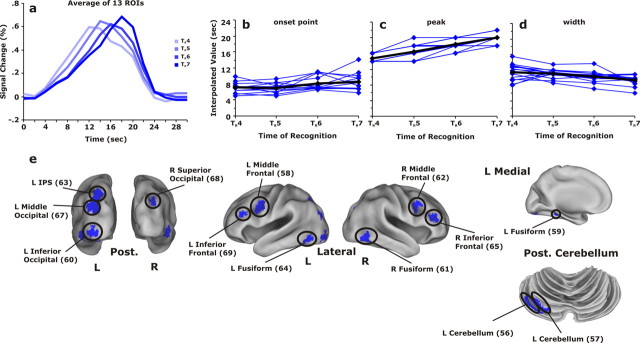
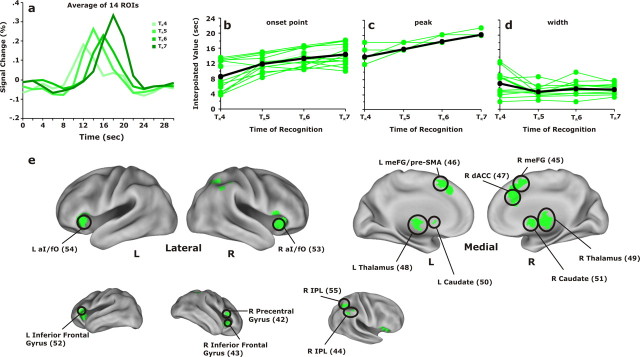
Decision making can be conceptualized as the culmination of an integrative process in which evidence supporting different response options accumulates gradually over time. We used functional magnetic resonance imaging to investigate brain activity leading up to and during decisions about perceptual object identity. Pictures were revealed gradually and subjects signaled the time of recognition (T(R)) with a button press. We examined the time course of T(R)-dependent activity to determine how brain regions tracked the timing of recognition. In several occipital regions, activity increased primarily as stimulus information increased, suggesting a role in lower-level sensory processing. In inferior temporal, frontal, and parietal regions, a gradual buildup in activity peaking in correspondence with T(R) suggested that these regions participated in the accumulation of evidence supporting object identity. In medial frontal cortex, anterior insula/frontal operculum, and thalamus, activity remained near baseline until T(R), suggesting a relation to the moment of recognition or the decision itself. The findings dissociate neural processes that function in concert during perceptual recognition decisions.


Figures

Figure 1.
Figure 1.
Task design and behavioral results. a, The schematic illustrates the task design. In Exp2, revelation proceeded every 2 s until the object was revealed at the eighth and final step (14 s). In Exp1 (not depicted), jitter occurred during revelation. Subjects pressed a button when they could identify the picture with a reasonable degree of confidence, and again at VoA if earlier recognition had been correct. ITIs (jitter) varied from 2 to 6 s. Revelation steps are numbered (1–8). b, c, Distribution of TRs for Experiments 1 and 2, in 2 s bins. The total number of responses (SD bars) are plotted as a function of the step of revelation. In Exp1, recognition responses were collapsed to identify ROIs. In Exp2, bins were analyzed separately to identify time-dependent differences in BOLD fMRI activity. c, The levels of shading represent the four main conditions of interest in Exp2 imaging analyses.
Figure 2.
Figure 2.
a–c, Idealized time course patterns in Exp2 related to sensory processing (a), accumulation (b), and moment of recognition processing (c). The graphs to the left depict time-dependent signal change (arbitrary units) in perceptual recognition at four different, successive, TRs (TR4–7). a, In sensory areas, onset, peak, and FWHM were not expected to vary as a function of TR. b, Because evidence gathering should begin when information becomes available, only time-to-peak in activity was expected to vary with TR in accumulators. c, Both onset and peak times should vary in moment of recognition regions that become active at the time of recognition. This late, discrete response should produce a narrow time course.
Figure 3.
Figure 3.
Cluster tree and averaged TR-dependent time courses. a, The cluster tree displays the similarity of time courses across ROIs in terms of a distance unit (1 − r). ROIs are listed along the y-axis and labeled according to atlas coordinate (cross-reference with Tables 1–4). ROIs linked across greater distances on the x-axis exhibited more disparate time courses. As 1 − r values approach 0, time course similarity increases. As 1 − r increases above +1.00, time courses become negatively correlated. The vertical dashed line shows where pruning the tree at 1 − r = 0.80 separated the tree into four major clusters. The cophenetic correlation coefficient was 0.8234, suggesting very little distortion in the data to construct the tree. b–e, Time courses for TR4–7 are averaged across all ROIs in each major subcluster. The time courses are color-coded by cluster membership and are graphed in units of percentage signal change from baseline (0%; horizontal dashed line).
Figure 4.
Figure 4.
Select regions of interest and their time course data. Regions of interest from Exp1 are shown near center, color-coded by Exp2 cluster membership at 1 − r = 0.8 (Fig. 3). ROIs are displayed in horizontal slices over the top of the anatomical template used in stereotaxic atlas transformation. Difference in millimeters from anterior commissure–posterior commissure is noted below each slice. In a–f, time courses for TR4–7 are graphed, in units of percentage signal change from baseline (0%), as a function of time. Time courses are color-coded according to the legend. TR1 began at 0 s. The onsets of steps 4–7 are denoted by different bar colors on the x-axis, as denoted by the legend. Step 8 (VoA), which began at 14 s, is denoted by a black bar on the x-axis. The marker for VoA is for reference only. a, Left ventral cuneus (peak voxel coordinate, −19, −99, +2); b, left IT (−42, −63, −9), c, left cuneus (−1, −83, +25); d, right precuneus (+2, −60, +37); e, meFG/pre-SMA (−1, +14, +51); f, right aI/fO (+33, +22, −2).
Figure 5.
Figure 5.
Hierarchical cluster analysis of interpolation data. Each of the 32 ROIs from the positive waveform cluster was subjected to interpolation analysis that defined each region's onset point, peak, and width. a, Cluster tree representing the three categories of regions based on the predicted outcomes from Figure 2. Red, Sensory processors; blue, accumulators; green, recognition regions. The cluster was cut at a 1 − r value of 0.2 to allow for each region to belong to a distinct cluster. The ideal values from Figure 2 were also placed into the correlation matrix to determine which of the 32 regions clustered near to or far from these hypothesized categories. b–d, Mean interpolation values for each of the three sets of regions identified in the cluster analysis separated by onset point, peak, and width. Error bars represent SEM. Note that the slope of increasing peak times (c) in sensory ROIs differed significantly from accumulation and recognition ROIs.
Figure 6.
Figure 6.
Interpolation analysis, sensory processors. a, Time courses for five sensory ROIs identified by the interpolation analysis. Time courses are shaded by TR (Fig. 4, caption). b–d, The data for each sensory region is shown in red, and the mean of those values is indicated by a thick black line for onset, peak, and width. e, The ROIs are shown projected onto inflated cortical surfaces of left and right hemispheres. L, Left; R, right; Post., posterior.
Figure 7.
Figure 7.
Interpolation analysis, accumulators. a, Time courses for 13 accumulator ROIs identified by the interpolation analysis. Time courses are shaded by TR (Fig. 4, caption). b–d, The data for each accumulator region are shown in blue, and the mean of those values is indicated by a thick black line for onset, peak, and width. e, ROIs are projected onto inflated cortical surfaces.
Figure 8.
Figure 8.
Interpolation analysis, moment of recognition areas. a, Time courses for 14 recognition ROIs identified by the interpolation analysis. Time courses are shaded by TR (Fig. 4, caption). b–d, The data for each recognition region are shown in green, and the mean of those values is indicated by a thick black line for onset, peak, and width. e, ROIs are projected onto inflated cortical surfaces.

Similar articles

Cited by

References

    1. Audley RJ, Pike AR. Some stochastic models of choice. Br J Math Stat Psychol. 1965;18:183–192.
    1. Biederman I. Recognition-by-components: a theory of human image understanding. Psychol Rev. 1987;94:115–147. - PubMed
    1. Botvinick M, Nystrom LE, Fissell K, Carter CS, Cohen JD. Conflict monitoring versus selection-for-action in anterior cingulate cortex. Nature. 1999;402:179–181. - PubMed
    1. Botvinick MM, Braver TS, Barch DM, Carter CS, Cohen JD. Conflict monitoring and cognitive control. Psychol Rev. 2001;108:624–652. - PubMed
    1. Boynton GM, Engel SA, Glover GH, Heeger DJ. Linear systems analysis of functional magnetic resonance imaging in human V1. J Neurosci. 1996;16:4207–4221. - PMC - PubMed

MeSH terms