. 2007 Oct 31;27(44):12025-32.
doi: 10.1523/JNEUROSCI.4094-07.2007.

Synaptic plasticity (and the lack thereof) in hippocampal CA2 neurons

Affiliations

Synaptic plasticity (and the lack thereof) in hippocampal CA2 neurons

Meilan Zhao et al. J Neurosci. .

Abstract

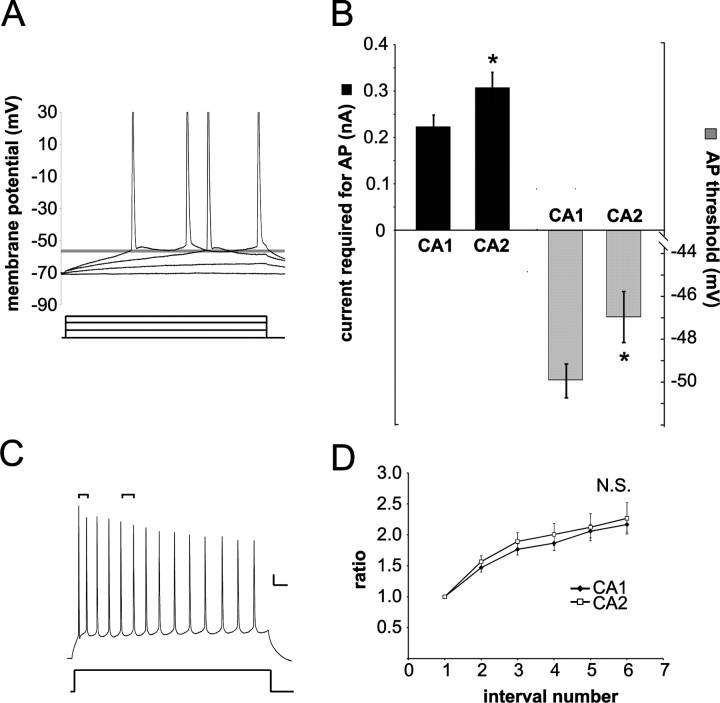
The hippocampus is critical for some forms of memory and spatial navigation, but previous research has mostly neglected the CA2, a unique region situated between CA3 and CA1. Here, we show that CA2 pyramidal neurons have distinctive physiological characteristics that include an unprecedented synaptic stability. Although basal synaptic currents in CA1 and CA2 are quite similar, synaptic plasticity including long-term potentiation and long-term depression is absent or less likely to be induced with conventional methods of stimulation in CA2. We also find that CA2 neurons have larger leak currents and more negative resting membrane potentials than CA1 neurons, and consequently, more current is required for action potential generation in CA2 neurons. These data suggest that the molecular "conspiracy against plasticity" in CA2 makes it functionally distinct from the other hippocampal CA regions. This work provides critical insight into hippocampal function and may lead to an understanding of the resistance of CA2 to damage from disease, trauma, and hypoxia.


Figures

Figure 1.
Figure 1.
Long-term potentiation is absent from CA2 neurons. Shown compared with LTP induced in rat CA1 neurons, a pairing protocol (3 Hz, with depolarization to 0 mV) is ineffective at inducting LTP in rat CA2 neurons. LTP is similarly impaired in the mouse CA2, relative to CA1, but shows greater short-term, or posttetanic potentiation than that seen in the rat (supplemental Fig. 3, available at www.jneurosci.org as supplemental material). The insets are traces from representative experiments from each area. Calibration: 25 pA, 10 ms. Amount of LTP induced from individual cases is shown, expressed as a percentage of the baseline value: CA1 (gray) and CA2 (black). The open circles represent those experiments performed in 50 μm picrotoxin. Hippocampal CA2 is illustrated with staining for STEP, which has been described previously (Boulanger et al., 1995). Error bars indicate SEM.
Figure 2.
Figure 2.
Synaptic properties recorded in CA1 and CA2 neurons. Excitatory synaptic currents in response to electrical stimulation were not significantly different between CA2 and CA1 neurons. A, A range of stimulation intensities up to 60 mA stimulation were used to evoke synaptic responses recorded in CA1 (black diamonds) and CA2 neurons (white squares). At no intensity were the two significantly different (n = 8 cells each). B, The level of PPF was determined by delivering two electrical pulses at varying intervals. The ratio of the amplitude of the second response to the amplitude of the first response is plotted according to the interval between the two pulses. PPF in CA2 was very similar to PPF in CA1, but was larger at the smallest interval (*p < 0.03; n = 10 cells each). C, mEPSCs did not differ between CA1 and CA2. Shown are example traces, NMDA/AMPA ratios, and frequency of events (n = 9 neurons each). Calibration: 10 pA, 100 ms. D, Representative NMDA receptor currents from CA1 and CA2 neurons, recorded at +40 mV. Calibration: 20 pA (CA1) and 10 pA (CA2), 25 ms. NMDA receptor-dependent current amplitudes did not differ significantly between CA1 and CA2 at several stimulation intensities (n = 10 in each case; p > 0.2 at all stimulation intensities, t test). Error bars indicate SEM.
Figure 3.
Figure 3.
Long-term depression is impaired in some CA2 neurons. Shown compared with LTD in CA1 neurons, LTD was induced in less than two-thirds of CA2 neurons. A, Average change in synaptic response to 2 Hz stimulation in cells clamped at −75 mV. Data are from 23 CA1 neurons and 34 CA2 neurons. Representative traces from cases in which LTD was induced (CA1 and CA2) and not induced (CA2), before, and 20 min after LTD-inducing stimulation are shown as insets. Calibration: 10 pA (CA1 and CA2 LTD) and 25 pA (CA2, no LTD), 10 ms. Portions of the stimulus artifacts were removed for clarity of the figure. B, Number of cases depressing after low-frequency stimulation. The distribution of cases in CA2 falls into a bimodal distribution with 13 of 34 cases failing to change significantly from baseline (black). Data from CA1 are shown for comparison (gray). The difference in the proportion of neurons expressing LTD between CA1 and CA2 is significant (Fisher's exact, p = 0.039; unequal variance t test, p < 0.05). C, Post hoc analysis of initial EPSC sizes at three different intensities in neurons in which LTD was induced (LTD; dashed line) or not induced (no-LTD; solid line) (n = 6 in each case). None are significantly different (p > 0.1 at all stimulation intensities). Error bars indicate SEM.
Figure 4.
Figure 4.
Passive membrane properties of CA2 neurons are different from those in CA1. A, Leak currents were recorded from CA1 and CA2 neurons with sodium gluconate substituted for sodium chloride, CoCl2, and ZD7288 to isolate leak potassium conductances. Currents were in response to 1-s-long voltage steps from −120 to −40 mV in 10 mV increments. Representative traces are shown. Calibration: 50 ms, 100 pA. Steady-state levels were plotted in B. n = 10 each for CA1 and CA2. C, Resting membrane potentials were significantly more negative in CA2 neurons than in CA1 neurons. **p < 0.001; n = 20 cells each. CA3 neurons had intermediate leak currents and membrane potentials (n = 10) (data not shown). Error bars indicate SEM.
Figure 5.
Figure 5.
Action potential properties in CA1 and CA2 neurons. Action potentials, recorded in current-clamp mode, were induced with 180-ms-long current pulses in 0.2 nA increments. An example is shown in A. B, The minimum current required to generate action potentials, and the membrane potential threshold that must be reached are compared in CA1 and CA2 neurons (*p < 0.05; n = 20 in both cases). D, Spike accommodation, measured as a ratio of the interval between the first two spikes induced with a 700-ms-long depolarization, was not significantly different between CA1 and CA2. An example is shown in C. Calibration: 50 ms, 10 mV. Error bars indicate SEM.

Similar articles

Cited by

References

    1. Adams PR, Constanti A, Brown DA, Clark RB. Intracellular Ca2+ activates a fast voltage-sensitive K+ current in vertebrate sympathetic neurons. Nature. 1982;296:746–749. - PubMed
    1. Alger BE, Teyler TJ. Long-term and short-term plasticity in the CA1, CA3, and dentate regions of the rat hippocampal slice. Brain Res. 1976;110:463–480. - PubMed
    1. Arai A, Kessler M, Lynch G. The effects of adenosine on the development of long-term potentiation. Neurosci Lett. 1990;199:41–44. - PubMed
    1. Asztely F, Xiao MY, Gustafsson B. Long-term potentiation and paired-pulse facilitation in the hippocampal CA1 region. NeuroReport. 1996;7:1609–1612. - PubMed
    1. Benes FM, Todtenkopf MS. Effect of age and neuroleptics on tyrosine hydroxylase-IR in sector CA2 of schizophrenic brain. NeuroReport. 1999;10:3527–3530. - PubMed

Publication types

MeSH terms

LinkOut - more resources