. 2007 Oct 31;27(44):12058-66.
doi: 10.1523/JNEUROSCI.2663-07.2007.

Differential modulation of motor cortical plasticity and excitability in early and late phases of human motor learning

Affiliations

Differential modulation of motor cortical plasticity and excitability in early and late phases of human motor learning

Karin Rosenkranz et al. J Neurosci. .

Abstract

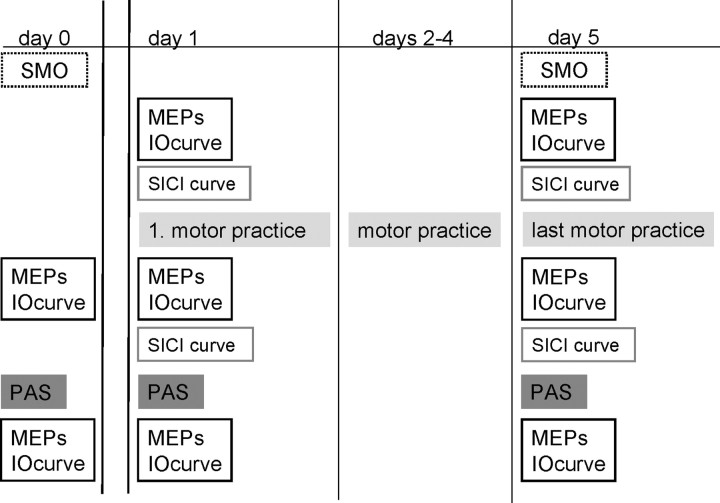
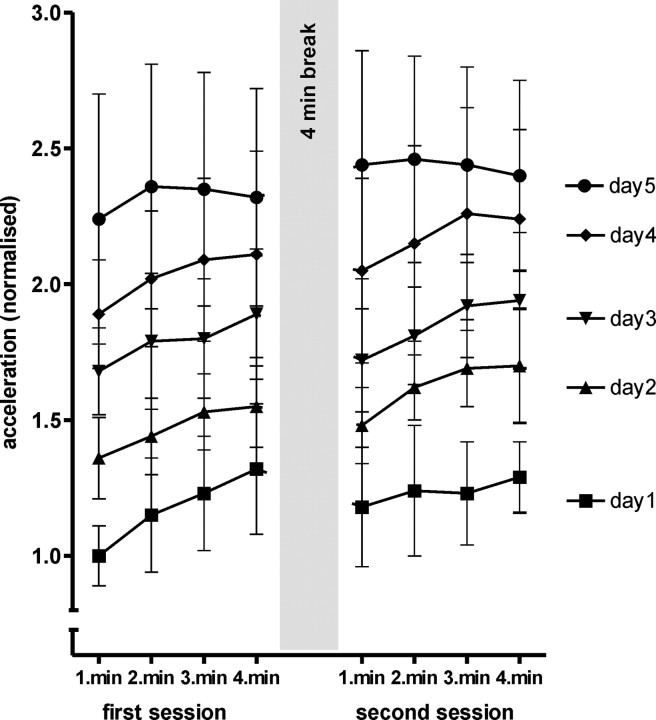
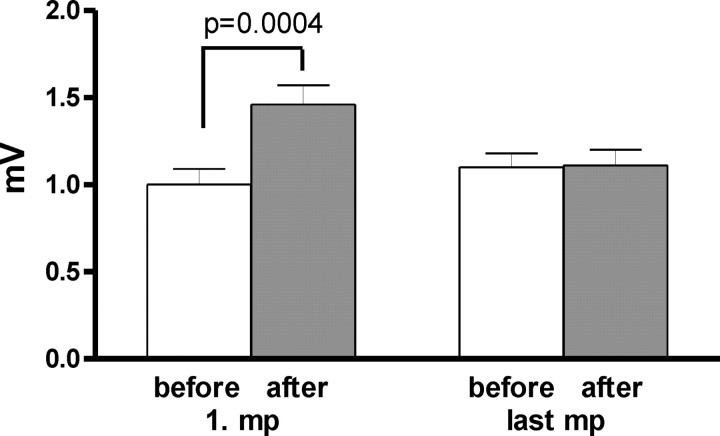
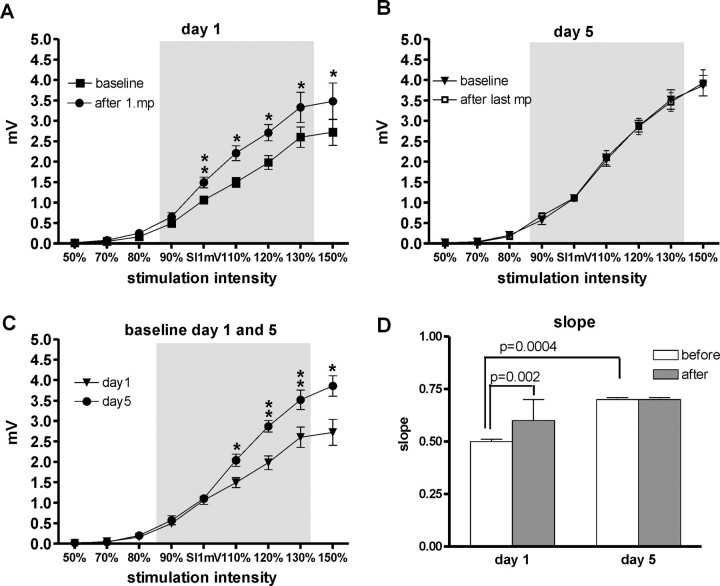
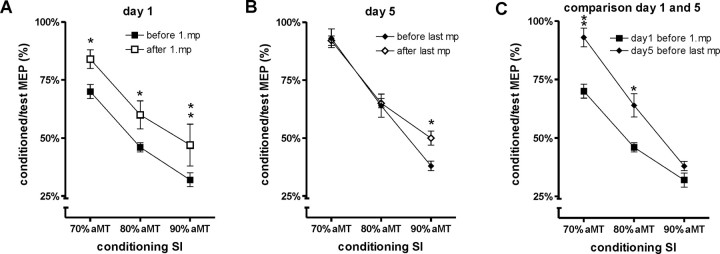
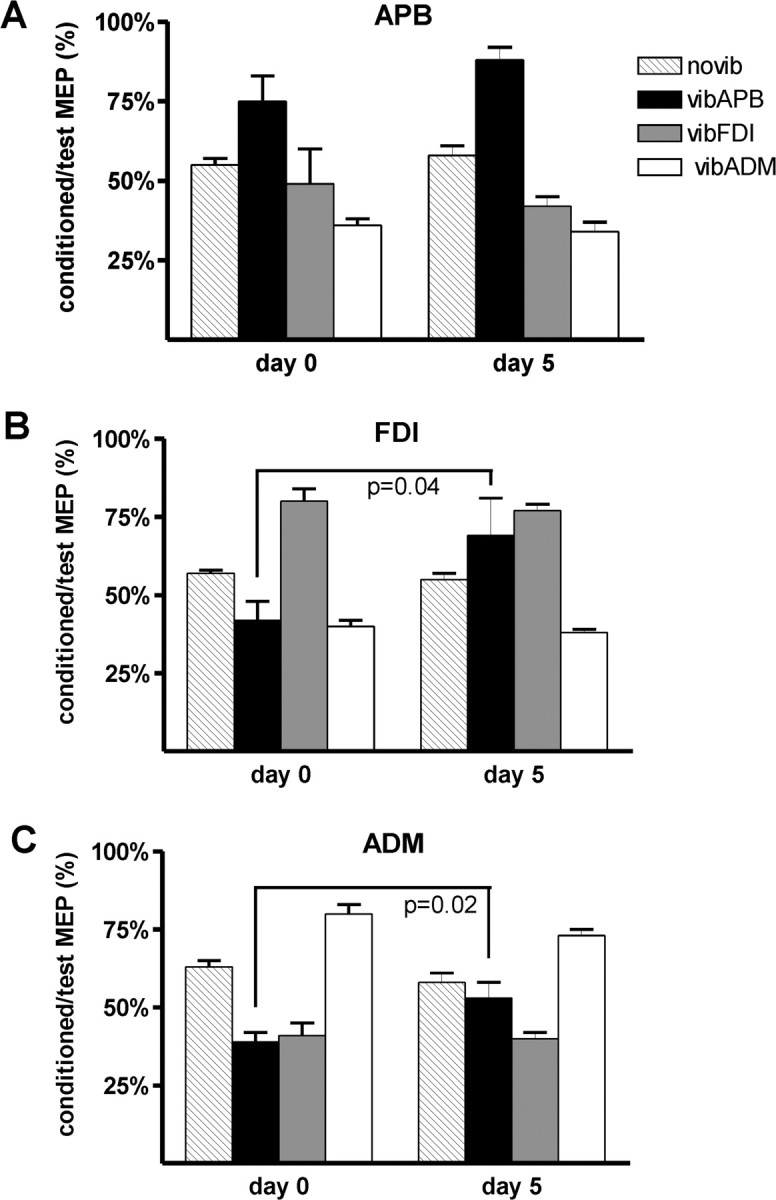
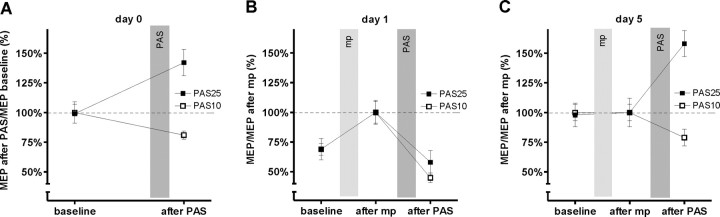
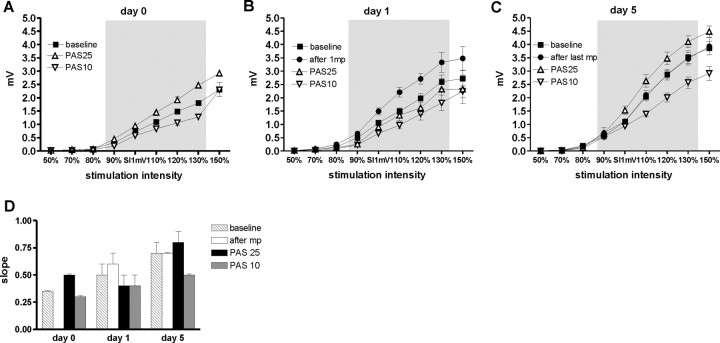
Different phases of motor skill learning appear to involve different physiological processes, with long-term potentiation (LTP) occurring at existing synapses in early and cortical reorganization involving synaptogenesis in later phases. Here, we test the evolution of skill learning-dependent changes in motor plasticity and excitability in six subjects trained to perform rapid thumb abductions over 5 d. Plasticity was examined using paired-associative stimulation (PAS) of the median nerve and motor cortex to induce LTP-like "PAS given with an interstimulus interval of 25 ms (PAS25)" or long-term depression (LTD)-like "PAS given with an interstimulus interval of 10 ms (PAS10)" plasticity. Excitability was tested by measuring recruitment of motor-evoked-potentials "input-output (IO) curve" and of short-latency intracortical inhibition (SICI curve), and sensorimotor organization (SMO). Task performance improved continuously over 5 d. After practice on day 1, the PAS25 effect reversed from facilitation to inhibition whereas the slope of the IO curve increased and the level of SICI decreased. These effects on IO curve and SICI were still present or even enhanced before the last practice on day 5, and were not changed by it. The effect of proprioceptive input from the trained muscle on SMO was also strengthened before practice on day 5. In contrast, PAS-induced plasticity was not influenced by motor practice on day 5, and had returned to prepractice values. The interference with PAS-induced plasticity suggests that the initial performance improvement relies on increasing the efficacy of existing synaptic connections. However, the long-lasting changes in the IO curve, SICI curve, and SMO suggest that continued practice enhances performance by changing Motor cortical organization. We hypothesize that new synaptic connections might have formed that allow LTP/LTD-susceptibility to be restored without reducing synaptic strength and performance skill.


Figures

Figure 1.
Figure 1.
Experimental protocol performed on days 0, 1, and 5. Subjects participated in two sets of experiments using this experimental protocol, testing the effect of PAS25 and PAS10 separately. All experiments and sessions of motor practice were performed in the morning.
Figure 2.
Figure 2.
Behavioral data showing the peak acceleration averaged for each minute of practice on each day. The practice was performed in two 4 min blocks, with a 4 min break in between to prevent fatigue. The data are normalized to the performance during the first minute of practice on day 1, which was not significantly different between the subjects (one-way ANOVA for subject, F(5,42) = 7.07; p = 0.09). The data obtained in the PAS25 and PAS10 studies have been pooled in this graph because there was no significant difference in performance on the two occasions.
Figure 3.
Figure 3.
Mean (±SE) amplitude of the MEPs of APB on days 1 and 5, before and after the first or last motor practice. On day 1, motor practice increased the MEP size significantly (t test, p = 0.0004), although it had no influence on day 5. (ANOVA, day 1/day 5 by motor practice, F(1,5) = 187.43; p < 0.0001).
Figure 4.
Figure 4.
IO curves measured in the APB muscle on days 1 and 5, before and after motor practice. A–C display the mean MEP amplitude (±SE) on the y-axis against the stimulus intensity on the x-axis (in percentage of SI1mV). A shows the IO curves measured on day 1 before and after the first motor practice. B shows the data for day 5 before and after the last motor practice. C compares the baseline IO curve on days 1 and 5 before motor practice. Asterisks indicate statistically significant differences between the displayed curves (paired t test, *p ≤ 0.05; **p ≤ 0.01). D displays the slopes of the IO curves on day 1 and day 5 before (white column) and after (gray column) motor practice. The slope of the curve has been calculated for the approximately linear part between 90 and 130% SI1mV. The IO curve on day 1 was significantly steeper after motor practice. In contrast, practice had no effect on the IO curve on day 5. However, the baseline IO curve on day 5 was steeper than on day 1. Statistical results (t test, p values) of the direct comparison of the slopes before and after motor practice on days 1 and 5 are given in D.
Figure 5.
Figure 5.
SICI obtained with a stimulus intensities of 70, 80, and 90% of aMT. The amount of inhibition is displayed as the size of the conditioned MEP as a percentage of MEP evoked by the test pulse alone (±SE). A displays the SICI before and after the first motor practice on day 1. B shows the same data for day 5. C displays a comparison of the SICI on day 1 and day 5 before motor practice. Higher values indicate reduced SICIs; lower values indicate increased SICIs. On day 1, practice reduced SICI, although this was not the case on day 5. However, there was less SICI before motor practice on day 5 than on day 1 (ANOVA, day 1/day 5 by conditioning SI, F(2,10) = 12.61; p = 0.002). Asterisks indicate statistically significant differences when comparing the displayed data directly (paired t tests, *p ≤ 0.05; **p ≤ 0.001).
Figure 6.
Figure 6.
Effect of motor practice on SMO. SICI (±SE) is expressed as percentage inhibition relative to unconditioned control values. A–C show data obtained in APB, FDI, and ADM, respectively. Each graph shows two sets of data, for days 0 and 5. On each day, the four columns display the amount of SICI measured without muscle vibration (novib), during vibration of APB (vibAPB), during vibration of FDI (vibFDI), and during vibration of ADM (vibADM). A decrease in SICI is shown as increased column size and an increase in SICI as reduced column size. On day 1, short-term vibration decreases SICI in the vibrated muscle and increases SICI in the nonvibrated muscles. On day 5, vibAPB causes a stronger decrease of SICI, especially in the APB and FDI. Statistical results (t test; p values) of direct comparisons of days 0 and 5 are given in the figure.
Figure 7.
Figure 7.
Mean MEP (±SE) on days 0, 1, and 5 in the APB. A shows the MEPs on day 0 expressed as percentage of baseline MEPs. B and C show the MEPs on days 1 and 5, respectively, expressed as percentages of MEPs after motor practice. On day 0, PAS25 enhanced and PAS10 decreased the MEPs. On day 1, motor practice increased the MEP relative to baseline, but the subsequent PAS effect was changed: both PAS10 and PAS25 decreased the MEP. On day 5, motor practice did not change MEP size relative to baseline whereas the PAS effects were similar to those on day 0. The interaction of day 0/day 1/day 5 by PAS type by before/after PAS was significant (three-way ANOVA, p < 0.004).
Figure 8.
Figure 8.
IO curves on days 0, 1, and 5. A–C display the mean MEP amplitude (±SE) on the y-axis against the stimulus intensity on the x-axis (in percentage of SI1mV). The IO curves obtained before and after motor practice were not significantly different in the experiments testing PAS25 and PAS10 and were therefore pooled. A shows the IO curves measured on day 0 before and after PAS25 and PAS10, respectively. B and C show the IO curves measured on days 1 and 5, respectively. PAS25 increased and PAS10 decreased the steepness of the IO curve on day 0. On day 1, motor practice made the IO curve steeper whereas subsequent PAS25 and PAS10 now reduced the IO curve below baseline levels. On day 5, motor practice had no effect on the IO curve and the effects of PAS25 and PAS10 had returned to those seen on day 0. D shows the slopes for all IO curves as displayed in A–C. Statistical analysis performed on these data with three-way ANOVA showed a significant interaction of day 0/day 1/day 5 by before/after PAS by PAS type (p < 0.01).

Similar articles

Cited by

References

    1. Bienenstock EL, Cooper LN, Munro PW. Theory for the development of neuron selectivity: orientation specificity and binocular interaction in visual cortex. J Neurosci. 1982;2:32–48. - PMC - PubMed
    1. Chen R. Interactions between inhibitory and excitatory circuits in the human motor cortex. Exp Brain Res. 2004;154:1–10. - PubMed
    1. DiLazzaro V, Restuccia D, Oliviero A, Profice P, Ferrara L, Insola A, Mazzone P, Tonali P, Rothwell JC. Magnetic transcranial stimulation at intensities below active motor threshold activates intracortical inhibitory circuits. Exp Brain Res. 1998;119:265–268. - PubMed
    1. Floyer-Lea A, Matthews PM. Distinguishable brain activation networks for short- and long-term motor skill learning. J Neurophysiol. 2005;94:512–518. - PubMed
    1. Hagbarth KE, Eklund G. Motor effects of muscle vibration in spasticity, rigidity and cerebellar disorders. Electroencephalogr Clin Neurophysiol. 1968;25:407. - PubMed

Publication types

MeSH terms

LinkOut - more resources