. 2007 Oct 31;27(44):12109-18.
doi: 10.1523/JNEUROSCI.1873-07.2007.

Cognitive signals in the primate motor thalamus predict saccade timing

Affiliations

Cognitive signals in the primate motor thalamus predict saccade timing

Masaki Tanaka. J Neurosci. .

Abstract

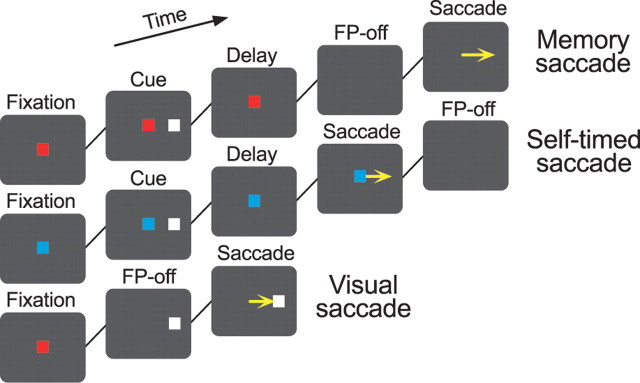
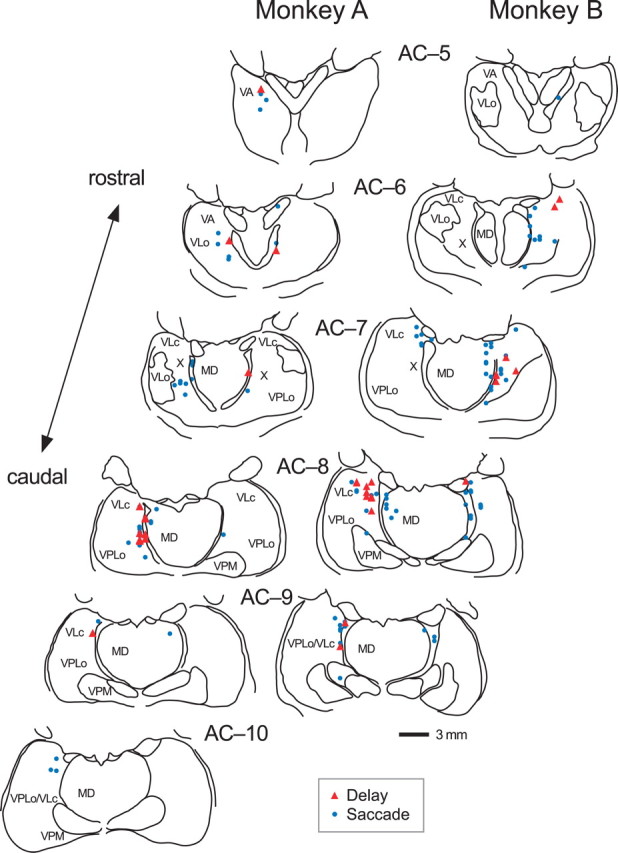
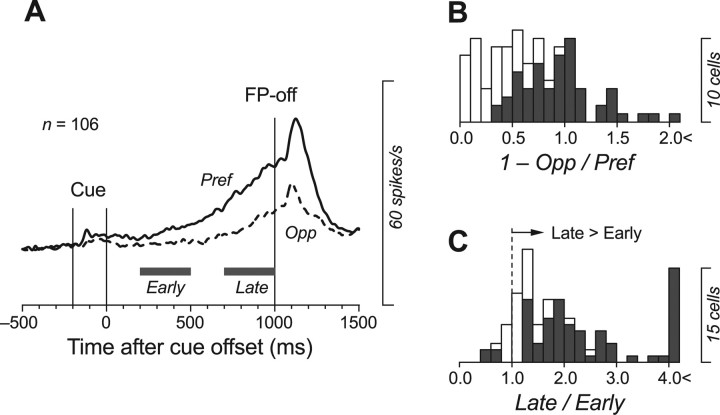
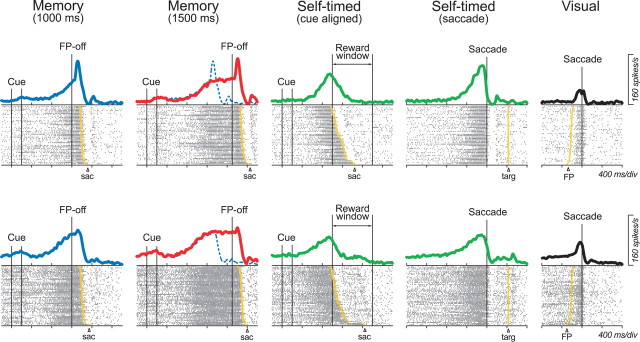
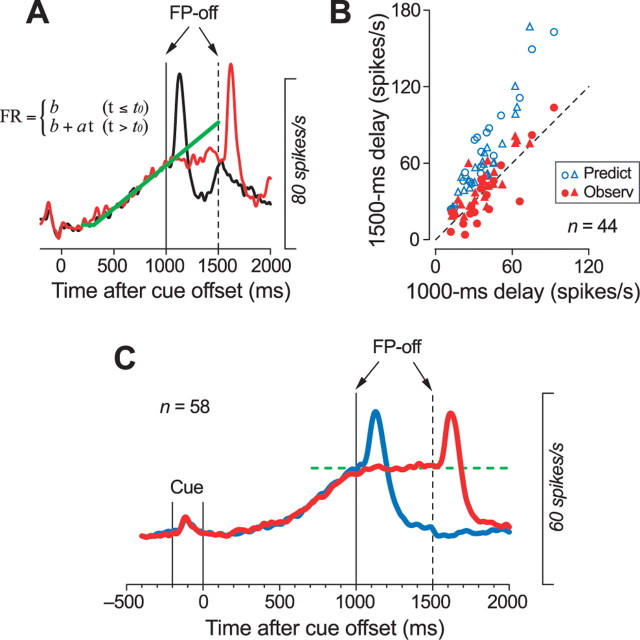
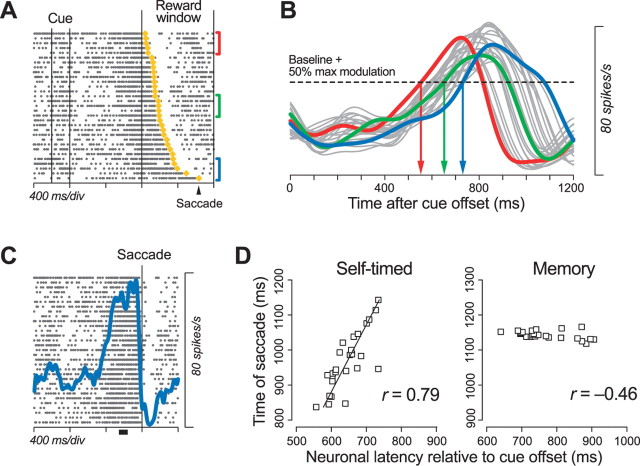
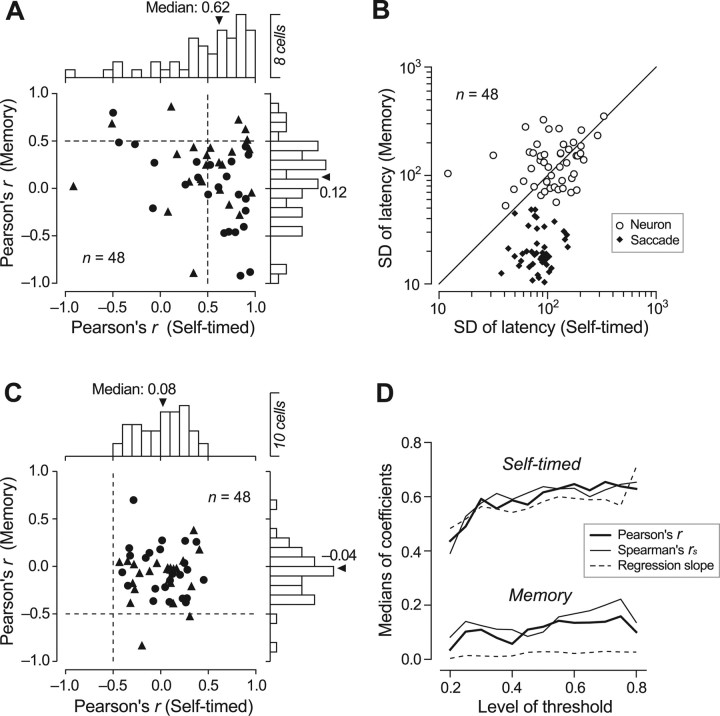
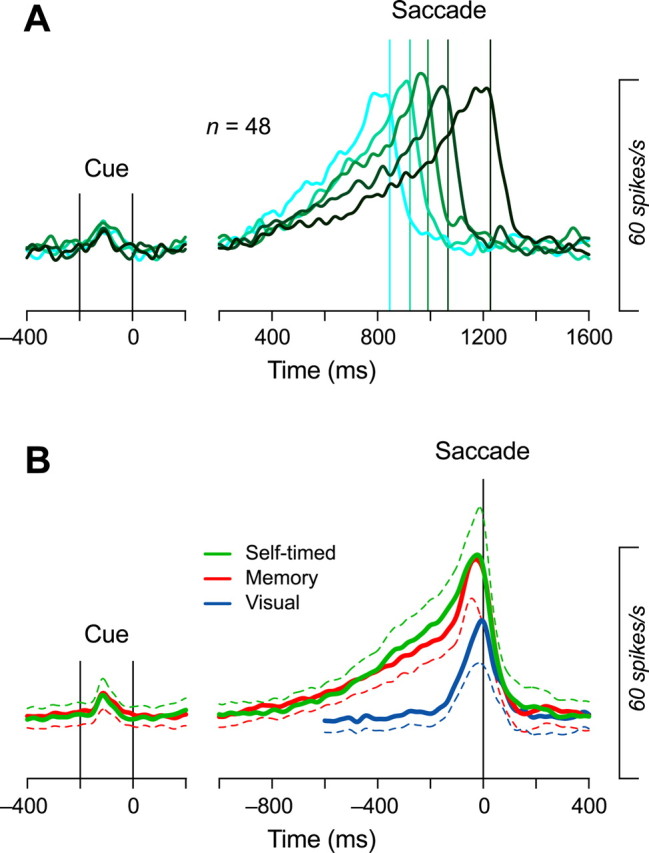
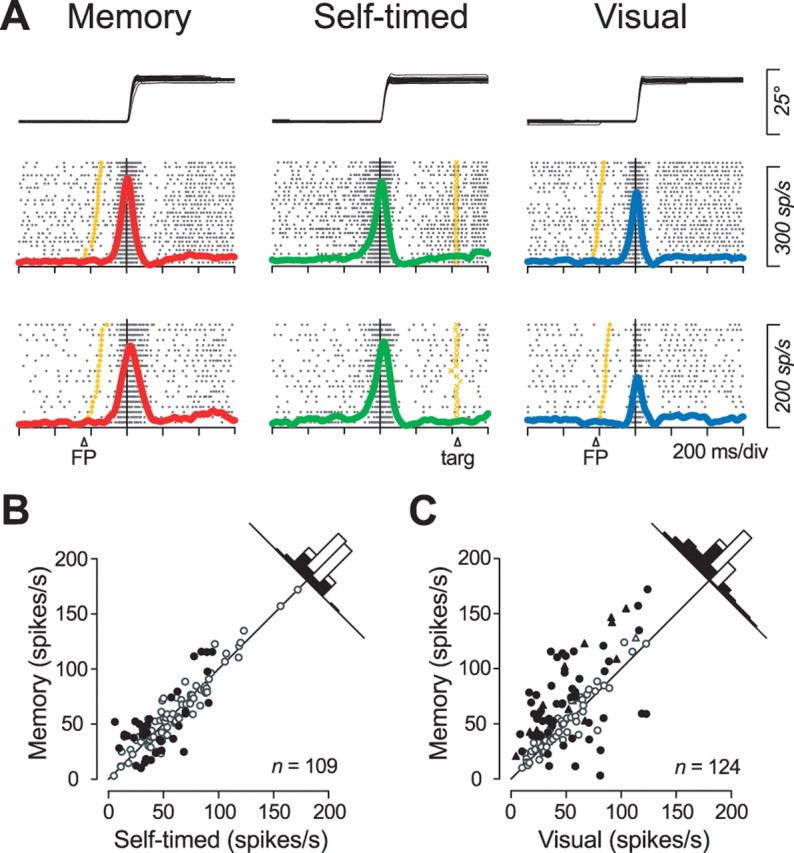
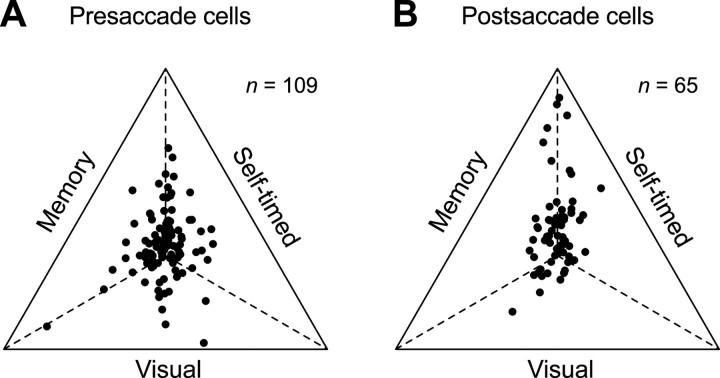
We often generate movements without any external event that immediately triggers them. How the brain decides the timing of self-initiated movements remains unclear. Previous studies suggest that the basal ganglia-thalamocortical pathways play this role, but the subcortical signals that determine movement timing have not been identified. The present study reports that a subset of thalamic neurons predicts the timing of self-initiated saccadic eye movements. When monkeys made a saccade in response to the fixation point (FP) offset in the traditional memory saccade task, neurons in the ventrolateral and the ventroanterior nuclei of the thalamus exhibited a gradual buildup of activity that peaked around the most probable time of the FP offset; however, neither the timing nor the magnitude of neuronal activity correlated with saccade latencies, suggesting that the brain is unlikely to have used this information to decide the times of saccades in the traditional memory saccade task. In contrast, when monkeys were required to make a self-timed saccade within a fixed time interval after an external cue, the same neurons again exhibited a strong buildup of activity that preceded saccades by several hundred milliseconds, showing a close correlation between the times of neuronal activity and the times of self-initiated saccades. The results suggest that neurons in the motor thalamus carry subjective time information, which is used by cortical networks to determine the timing of self-initiated saccades.


Figures

Figure 1.
Figure 1.
Sequence of events in three saccade paradigms. Monkeys made a saccade in response to the fixation point offset (memory task and visual task), or within 1200 ± 400 ms of the cue offset (self-timed task). The color of the FP was red in the former two tasks, but was blue in the latter task to inform monkeys of the trial type. Monkeys obtained the same amount of reward for each correct behavior in the three saccade paradigms. Trials were presented randomly in a block, which consisted of seven different tasks including five memory saccade tasks and two other tasks (see Materials and Methods).
Figure 2.
Figure 2.
Locations of neurons in two monkeys. Recording sites were reconstructed from histological sections (50 μm, stained with cresyl violet) on the basis of stereotaxic coordinates of electrode penetrations and several electrolytic lesions made during experiments. Red triangles indicate neurons showing a significant firing modulation during the delay period in the memory saccade task. Blue dots indicate neurons showing a brief burst of activity associated with saccades. Neurons with both the properties are plotted by red triangles. The levels of frontal sections are shown as the position posterior to the anterior commissure (AC). MD, Mediodorsal nucleus; VA, ventroanterior nucleus; VLc and VLo, caudal and oral divisions of ventrolateral nucleus, respectively; VPLo, oral division of ventroposterolateral nucleus; VPM, ventroposteriomedial nucleus; X, area X.
Figure 3.
Figure 3.
Neurons in the ventrolateral thalamus show a ramping up of firing rate during the delay period. A, Population activity in the memory saccade task with a delay of 1000 ms. B, Distribution of directionality index. The index was measured for individual neurons as 1 − Opp/Pref, where Pref indicates the activity during the last 400 ms of the delay period minus the baseline activity for trials in the preferred direction, and Opp indicates those for trials in the opposite direction. Data with statistically significant directional modulation (Wilcoxon rank-sum test, p < 0.05) are plotted as filled bars (n = 58; 55%). C, Ratio of late activity (700–1000 ms) to early activity (200–500 ms) during the delay period, for individual neurons. Values were >1.0 for most neurons (90%), indicating that the activity gradually increased over time during the delay period. Data showing a statistically significant difference (p < 0.05) are plotted by filled bars (n = 72; 68%).
Figure 4.
Figure 4.
Activity of two thalamic neurons in four different conditions. Each row plots data from a buildup neuron with (top) or without (bottom) a saccade-related burst of activity. For each panel, data are aligned with either the cue onset (left 3 columns) or saccades (other columns) in the preferred direction, and are sorted according to saccade latency. Data in the third and fourth columns are identical, but are aligned with different time references. Solid continuous traces indicate spike densities for the associated rasters. The blue dashed traces in the second column plot the same spike densities as those in the first column for comparison. Yellow symbols indicate the times of saccade (left 3 columns), reappearance of the target (fourth column), or FP offset (right column).
Figure 5.
Figure 5.
The time course of buildup activity predict the timing of fixation point offset in the memory saccade task. A, An example illustrating how we compared the activities between trials with different delay intervals for individual neurons. Based on data from the memory saccade task with a 1000 ms delay (standard trial), we tried to estimate the firing rate at the end of a probe trial with a 1500 ms delay. Because the firing rate during the delay period increased linearly, we fitted a line (least squares) to the spike density (black trace) for the standard trial. The fitted function incorporated a recruitment threshold, and the spike densities during the 200–1000 ms after the cue offset were used for the fitting. B, The predicted activity was compared with the actual measures in the probe trials (the last 100 ms in the delay period). For almost all neurons, the observed activity was less than the predicted activity. Data for observed activity (red symbols) distributed around the equality line, indicating that many neurons showed a similar amount of activity at the time of FP offset, regardless of the length of the delay interval. Data for neurons that showed a transient activity after the FP offset are plotted by triangles. C, Time course of population activity for memory saccade tasks with different delay intervals. Note that the activity remained unchanged throughout the extended delay period in the probe trial (red trace). Data for 14 neurons whose activity did not fit well with a line (r2 < 0.7) also contributed to the population activity.
Figure 6.
Figure 6.
Analysis of the correlation between neuronal and behavioral latencies. A, Data from a neuron exhibiting a buildup of activity in the self-timed task are aligned with the cue onset. Times of saccade initiation are shown as yellow dots, and the trials are sorted according to saccade latency. B, Spike densities were obtained from every five consecutive trials for the neuron shown in A. Traces in colors indicate spike densities for trials marked by the corresponding colors in A. The neuronal latency was measured when the spike density exceeded half of the maximal modulation of neuronal activity (dashed line). C, The maximal modulation was defined as the difference in activity measured during the 250–150 ms before saccade initiation (black bar) and that measured 300 ms before cue onset (baseline). D, Each panel compares the neuronal and behavioral latencies for either the self-timed task or the memory task. The behavioral latencies are the means of five trials, and are expressed as the time from the cue offset in both tasks.
Figure 7.
Figure 7.
Correlation with saccade latency. A, Correlation between neuronal and behavioral latencies. For each neuron, the latencies were measured using the methods summarized in Figure 6. The correlation coefficients were greater for the self-timed saccade task than for the memory saccade task (paired t test, one-tailed, p < 10−3). Data from neurons that showed a transient activity after the FP offset are plotted by triangles. B, Comparison of variations in neuronal and behavioral latencies. Each data point plots SDs for the means of every five trials that were grouped according to saccade latency and were used to compute the correlation coefficients plotted in A. C, Lack of correlation between the firing rate and saccade latency. For individual neurons, correlation coefficients were computed between the magnitude of neuronal activity and saccade latency for every five consecutive trials, sorted by saccade latency. The neuronal activity was measured between 250 and 150 ms before saccade initiation (self-timed task) or during the 100 ms before fixation point offset (memory task). The correlation coefficients were not statistically different between the tasks (paired t test, two-tailed, p = 0.10). D, Medians of correlation and regression coefficients between neuronal and saccade latencies for different levels of criterion to measure the neuronal latency. The level of threshold at the half of the maximal firing modulation (threshold level = 0.5) was used to compute the data plotted in A and B.
Figure 8.
Figure 8.
Time courses of the population activity. A, Activity in the self-timed saccade task. For each neuron, data were divided into five groups according to saccade latencies. Data were aligned either on the cue (left) or saccades (right), then were averaged across the population. In the right panel, traces are shifted in time so that the times of saccades are placed at the means of the saccade latency relative to the cue offset (vertical lines). B, Comparison between the three saccade paradigms. Data for 48 neurons are aligned on the cue (left) or saccades (right). Dashed traces indicate plus or minus 95% confidence interval. Note that the population activity for the self-timed task was slightly enhanced ∼400 ms before saccades in comparison with that for the memory saccade task.
Figure 9.
Figure 9.
Comparison of presaccadic burst activity between three different tasks in the preferred direction. A, Activity of two example neurons aligned on saccade initiation. B, C, Quantitative comparison of burst activity measured during a 150 ms window within a 350 ms interval starting from 200 ms before saccade initiation. The measuring window was placed to obtain maximal activity across paradigms. Filled symbols indicate data with a significant difference according to multiple comparisons (Scheffé, p < 0.05). Data for neurons that were not examined in the self-timed task are plotted by triangles in C.
Figure 10.
Figure 10.
Relative magnitudes of saccade-related burst activity across three paradigms. A, The maximal activity before and during saccades was measured for each presaccadic neuron and paradigm, as in Figure 8, B and C. Data for the three tasks were normalized so that the distance from each side of the triangle is proportional to the inverse of the firing rate measured for the corresponding task. The data points on each dashed line indicate neurons showing an equal amount of activity for the two tasks. B, Data from postsaccadic burst neurons. The neuronal activity was measured during a 150 ms time window located within a 350 ms interval starting from 50 ms after saccade initiation.

Similar articles

Cited by

References

    1. Alexander GE, DeLong MR, Strick PL. Parallel organization of functionally segregated circuits linking basal ganglia and cortex. Annu Rev Neurosci. 1986;9:357–381. - PubMed
    1. Anderson ME, Turner RS. Activity of neurons in cerebellar-receiving and pallidal-receiving areas of the thalamus of the behaving monkey. J Neurophysiol. 1991;66:879–893. - PubMed
    1. Buhusi CV, Meck WH. What makes us tick? Functional and neural mechanisms of interval timing. Nat Rev Neurosci. 2005;6:755–765. - PubMed
    1. Carpenter RH, Williams ML. Neural computation of log likelihood in control of saccadic eye movements. Nature. 1995;377:59–62. - PubMed
    1. DeVito JL, Anderson ME. An autoradiographic study of efferent connections of the globus pallidus in Macaca mulatta. Exp Brain Res. 1982;46:107–111. - PubMed

Publication types