. 2008 Jan;19(1):181-97.
doi: 10.1091/mbc.e07-04-0385. Epub 2007 Oct 31.

Distinct roles for two Galpha-Gbeta interfaces in cell polarity control by a yeast heterotrimeric G protein

Affiliations

Distinct roles for two Galpha-Gbeta interfaces in cell polarity control by a yeast heterotrimeric G protein

Shelly C Strickfaden et al. Mol Biol Cell. 2008 Jan.

Abstract

Saccharomyces cerevisiae mating pheromones trigger dissociation of a heterotrimeric G protein (Galphabetagamma) into Galpha-guanosine triphosphate (GTP) and Gbetagamma. The Gbetagamma dimer regulates both mitogen-activated protein (MAP) kinase cascade signaling and cell polarization. Here, by independently activating the MAP kinase pathway, we studied the polarity role of Gbetagamma in isolation from its signaling role. MAP kinase signaling alone could induce cell asymmetry but not directional growth. Surprisingly, active Gbetagamma, either alone or with Galpha-GTP, could not organize a persistent polarization axis. Instead, following pheromone gradients (chemotropism) or directional growth without pheromone gradients (de novo polarization) required an intact receptor-Galphabetagamma module and GTP hydrolysis by Galpha. Our results indicate that chemoattractant-induced cell polarization requires continuous receptor-Galphabetagamma communication but not modulation of MAP kinase signaling. To explore regulation of Gbetagamma by Galpha, we mutated Gbeta residues in two structurally distinct Galpha-Gbeta binding interfaces. Polarity control was disrupted only by mutations in the N-terminal interface, and not the Switch interface. Incorporation of these mutations into a Gbeta-Galpha fusion protein, which enforces subunit proximity, revealed that Switch interface dissociation regulates signaling, whereas the N-terminal interface may govern receptor-Galphabetagamma coupling. These findings raise the possibility that the Galphabetagamma heterotrimer can function in a partially dissociated state, tethered by the N-terminal interface.


Figures

Figure 1.
Figure 1.
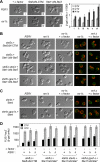
Chemotropism role of Gαβγ and receptor is separate from signaling. (A) Chemotropism requires Ste4 even when its signaling role is bypassed. Strains PPY858 (ste5Δ) and PPY886 (ste5Δ ste4Δ) harbored galactose-inducible forms of Ste5 (pPP452), Ste5ΔN-CTM (pPP513), Ste5ΔN-Sec22 (pPP524), Ste11ΔN (pPP575), or Ste12 (pPP741 or pPP271). Chemotropic proficiency (left) was assessed by patch matings performed in the absence (−) or presence (+) of exogenous α factor. The mating results using Ste5 derivatives show the more-dilute 2° replica, whereas the others show the 1° replica (see Materials and Methods). Results were similar in both a and α cells, and in both W303 and 381G strain backgrounds (unpublished observations). Transcriptional activation of FUS1-lacZ (right) is shown for the same strains and plasmids after galactose induction ± α factor. Bars, mean ± SD (n = 3). To emphasize that transcription levels were not the primary determinant of mating efficiency, results are shown using Ste12 overexpression constructs that yield high (hi) or low (lo) levels of transcriptional induction (due to different vector contexts). (B) Ste4 can perform its chemotropism role without Ste5 and Ste20. Quantitative matings were performed ± exogenous α factor. Strains PPY863 and PPY842 harbored galactose-inducible Ste11ΔN (pRD-STE11-H3) or Ste12 (pNC252). Bars, mean ± range (n = 2). (C) An intact receptor–Gαβγ module is required for chemotropism. Signaling was activated by galactose-inducible constructs (pPP513, pPP575, and pPP741) in the indicated strains (PPY858, PPY979, PPY978, PPY886, and PPY989). Chemotropism was monitored by patch or quantitative mating assays in the absence (−) or presence (+) of α factor. Bars, mean ± SD (for Ste5ΔN-CTM; n = 4) or mean ± range (n = 2). Transcriptional activation of FUS1-lacZ by the same constructs after galactose induction ± α factor was similar in all strains (data not shown). (D) Zygote formation. Strains from C, harboring galactose-inducible GFP-Ste5ΔN-CTM (pPP513), were mated with PT2α partner cells for 5.5 h. Representative fields of DIC and fluorescence (GFP) images are shown. We counted 500 cells for each mixture, and the percentage that were zygotes is shown.
Figure 2.
Figure 2.
De novo polarization requires pheromone and Gα, in addition to Gβγ. (A) Polarization was examined in RSR1 or rsr1Δ cells, after signaling was activated by α factor (strains PPY398 and PPY1259) or by galactose induction of PGAL1-STE5ΔN-CTM (strains PPY1303 and PPY1306) or PGAL1-STE11ΔN-STE7 (strains PPY1309 and PPY1312). Right, the same strains were transformed with a FUS1-lacZ reporter (p3058), and transcriptional induction (mean ± SD; n = 4) was monitored 0, 2, and 4 h after addition of galactose with (i and ii) or without (iii–vi) α factor. (B) Pheromone, Ste4, and Gpa1 are required for de novo polarization. The indicated rsr1Δ strains harboring PGAL1-STE5ΔN-CTM or PGAL1-STE11ΔN-STE7 (PPY1307, PPY1313, PPY1314, and PPY1952) were treated with galactose ± α factor. Congenic RSR1 strains (PPY1304, PPY1310, PPY1311, and PPY1951) show that the galactose-inducible constructs can activate polarization by the default pathway. Right, old cell wall was labeled with FITC-ConA (green), and new cell wall formed during the period of mating pathway activation was labeled with TRITC-ConA (red). (C) Free Gβγ is not sufficient for de novo polarization. Strains PPY794, PPY1228, PPY1248, and PPY1380 harboring PGAL1-STE4 (pGT-STE4) were induced with galactose ± α factor. At right, old and new cell wall was labeled as in B. (D) Conditions affecting de novo polarization do not affect transcription. The eight strains in B were transformed with reporter plasmid p3058, and FUS1-lacZ induction (mean ± SD; n = 4) was monitored 2–4 h after addition of galactose ± α factor.
Figure 3.
Figure 3.
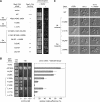
Ste4 mutations in Gα–Gβ binding interfaces. (A) Model for orientation of the G protein-coupled receptor rhodopsin, the heterotrimeric G protein transducin, and the membrane. Adapted from Hamm, 2001; copyright Proceedings of the National Academy of Sciences USA. (B) Effects of Ste4 mutations on Gpa1 binding. Mutated Ste4 residues are listed alongside their homologous residues in mammalian Gβ1. Activation domain fusions (AD-Ste4) were expressed in a gpa1Δ ste11Δ two-hybrid tester strain (PPY1158), with DNA-binding domain fusions to Gpa1 (pPP247) or to the Gβγ-binding regions of Ste5 (pPP305) or Far1 (pPP743). Binding was detected by growth on −His plates ± 3-aminotriazole (3-AT; an inhibitor of His3), or by quantitative β-galactosidase assay (bars, mean ± SD; n = 4). To reveal the full range of effects on Gpa1 binding, quantitative assays used AD–Ste4 fusions expressed from either a strong promoter (derivatives of pPP643) or a weak promoter (derivatives of pPP268); plate growth assays used pPP643 derivatives. As controls (at bottom), two additional Ste4 mutations outside the Gα–Gβ interfaces (see Materials and Methods) were analyzed in parallel; these disrupt binding to Ste5 and Far1, but not to Gpa1. (C) Ste4 mutations cause deregulated signaling. To avoid constitutive growth arrest, the Ste4 mutants were tested in ste4Δ ste7Δ cells (PPY1662) harboring PGAL1-STE7 (pPP2773). FUS1-lacZ induction (mean ± SD; n = 4) was measured 2 h after addition of galactose ± α factor. Ste4 was expressed from the native STE4 promoter (derivatives of pPP2968; vector = pRS316). (D) Ste4 mutations disrupt coimmunoprecipitation with Gpa1. HA-tagged Gpa1 (pPP2775) or vector (pRS314) was coexpressed with myc-tagged Ste4 (derivatives of pPP2838; vector = pRS316) in strain PPY1230 (gpa1Δ ste4Δ ste5Δ). Cell extracts were analyzed by immunoprecipitation (IP) and immunoblotting (blot).
Figure 4.
Figure 4.
Ste4 mutations in the Nt interface, but not the Sw interface, disrupt polarity control. (A) Chemotropism proficiency was assessed by patch mating assays performed in the absence (−) or presence (+) of exogenous α factor. PPY867 (ste4Δ ste5Δ) harbored PGAL1-STE5ΔN-SEC22 (pPP524) and either vector (pRS316) or Ste4 variants expressed from the native STE4 promoter (derivatives of pPP2968). The effects of the Ste4 mutations on Gpa1 binding are summarized for reference (see Figure 3B). (B) Analysis of additional Nt interface mutants. Left, two-hybrid binding assays (as in Figure 3B) using AD–Ste4 fusions (derivatives of pPP643; vector=pPP636) and DBD-Gpa1 (pPP247) in PPY1158. (Note: in quantitative assays using the lacZ reporter, the Gpa1 interaction signal of Ste4-K126A was measurably reduced to 27% of Ste4-WT.) Right, quantitative assays of Ste4 function during chemotropic mating. PPY867 (ste4Δ ste5Δ) harbored PGAL1-STE5ΔN-SEC22 (pPP524) and either vector (pRS316) or Ste4 variants (derivatives of pPP2968). As Ste4 affects mating under these conditions only when gradients are intact (see Figures 1, A–C, and 4A), these assays were conducted only in the absence of exogenous α factor. Results (mean ± SD; n = 4) were normalized to the average mating efficiency of wild-type Ste4. (C) Default and de novo polarization phenotypes. To avoid constitutive growth arrest, Ste4 mutants were expressed from the GAL1 promoter (derivatives of pPP1151) in PPY794 (ste4Δ RSR1) or PPY1248 (ste4Δ rsr1Δ), and cell morphology was examined after induction with galactose ± α factor.
Figure 5.
Figure 5.
Allele-specific suppression of a Ste4 Nt interface mutant. (A) Red side chains highlight an ion pair predicted to form between Ste4(Gβ)-K126 and Gpa1(Gα)-E28 in the Nt interface, based on homologous residues (Gβ-K89 and Gα-E16) in transducin (Lambright et al., 1996). Structural rendering of Gαβγ used Protein Data Bank coordinate set #1GOT and Cn3D version 4.1 software (National Center for Biotechnology Information/National Library of Medicine). (B) Two-hybrid assay showing that the Gpa1-E28K mutation partially restores interaction with Ste4-K126E. DBD fusions to Gpa1 derivatives (pPP247, pPP1502, and pPP1505) were coexpressed in PPY762 with AD–Ste4 fusions under control of either a strong or weak promoter (pPP636, pPP643, pPP1121, or pPP249). Bars, mean ± SD (n = 3). (C) Gpa1-E28K partially suppresses the chemotropism defect of Ste4-K126E. Patch mating assays used ste4Δ gpa1Δ ste5Δ cells (PPY1230) harboring PGAL1-STE5ΔN-SEC22 (pPP524) and the indicated combinations of GPA1 (YCpGPA1, pPP1501, pPP1503), and STE4 (derivatives of pPP226). (D) Quantitative mating assay measuring suppression of Ste4-K126E by Gpa1-E28K. Cells were as in panel C, mated to partner strain PT2α in the absence of exogenous α factor. Mating frequencies from eight independent 7-h mating experiments were expressed relative to the average of the fully wild-type combination (Gpa1-WT + Ste4-WT). Bars, mean ± SEM (n = 8). For Ste4-K126E matings, the difference between Gpa1-WT and Gpa1-E28K (means, 4.1 vs. 18.7%) was ranked highly significant (p < 0.0005) by a two-tailed unpaired Student's t test.
Figure 6.
Figure 6.
Qualitative differences between Ste4 Nt and Sw mutants are independent of Gpa1–Fus3 interaction. (A) Patch mating assays used the following strain and plasmid combinations. Left, strain PPY1228 (ste4Δ gpa1Δ) harbored the indicated Gpa1 derivatives (pPP2711 or pPP2743) and PGAL1-STE4 plasmids (derivatives of pPP1151). Center right, strain PPY1230 (ste4Δ gpa1Δ ste5Δ) harbored Gpa1 derivatives (pPP2711 or pPP2743) plus native STE4 plasmids (derivatives of pPP226) and either PGAL1-STE5ΔN-CTM (pPP479) or PGAL1-STE5ΔN-SEC22 (pPP1175). Far right, strain PPY1937 (fus3Δ ste4Δ) harbored the indicated PGAL1-STE4 plasmids. (B) Pheromone confusion assay showing that fus3Δ cells are chemotropically proficient. Strains, from top to bottom: PPY577, PPY824, PPY827, and PPY836. Similar results were also seen in S288C and W303 strain backgrounds (unpublished observations). (C) Quantitative mating assay of strains PPY663, PPY817, PPY498, and PPY820 expressing galactose-inducible Ste12 (pPP271). Cells were mated for 18 h, ± exogenous α factor. Bars, mean ± SD (n = 3).
Figure 7.
Figure 7.
Phenotypes of Ste4–Gpa1 fusion proteins. (A) A Ste4–Gpa1 fusion expressed from the native STE4 promoter functions indistinguishably from separate Ste4 and Gpa1 polypeptides. Halo assays show growth arrest of ste4Δ gpa1Δ cells (PPY1228) or ste4Δ gpa1Δ sst2Δ cells (PPY1942) harboring Gpa1 and Ste4 as separate (YCplac22-GPA1-WT + pPP226) or fused (pPP1340 + pRS314 vector) polypeptides. (B) FUS1-lacZ assays (mean ± SD; n = 4) showing that the Ste4-Gpa1 fusion retains a normal dose response to pheromone. PPY1663 (ste4Δ gpa1Δ) harbored plasmids as in A. Cells were treated with the indicated concentration of α factor for 2 h. (C) Patch mating assay of strains PPY1230 (ste5Δ ste4Δ gpa1Δ) or PPY886 (ste5Δ ste4Δ GPA1) harboring PGAL1-STE5ΔN-CTM (pPP473) plus pRS316, pPP226, or pPP1340. (D) Patch mating assays showing that the Ste4-Gpa1 fusion protein remains proficient at chemotropism. Strain PPY1230 carried PGAL1-STE5ΔN-CTM (pPP479) and the following plasmid combinations: pPP2711 + pRS316, pRS314 + pPP226, pPP2711 + pPP226, or pRS314 + pPP1340. (E) The Ste4-Gpa1 fusion context reveals distinct signaling phenotypes for the Ste4 Nt and Sw mutants. Top, strain PPY1662 (ste4Δ ste7Δ) harbored a PGAL1-STE7 construct (pPP2773) plus either vector (pRS316) or the indicated STE4 or STE4-GPA1 fusion alleles, expressed from the native STE4 promoter. Bottom, strain PPY856 (ste4Δ) harbored either vector (pPP446) or the indicated PGAL1-STE4 or PGAL1-STE4-GPA1 fusion constructs. FUS1-lacZ activation was measured after induction with galactose ± α factor. Bars, mean ± SD (n = 4). (F) The Ste4 mutations do not affect protein levels. Lysates of cells harboring myc-tagged Ste4 (derivatives of pPP2838) or myc-tagged Ste4-Gpa1 (derivatives of pPP2839) were analyzed by anti-myc immunoblot. (Relevant portions of each blot are shown; as expected, myc-Ste4-Gpa1 runs considerably larger than myc-Ste4.)
Figure 8.
Figure 8.
Polarity control requires GTP hydrolysis by Gpa1. (A and B) De novo polarization was monitored using ste4Δ gpa1Δ rsr1Δ cells (PPY1380) expressing Ste4 and Gpa1 variants as either separate or fused polypeptides, after 4-h induction with galactose ± α factor. Separate Ste4 and Gpa1 subunits were expressed from pPP1151, pPP1228 (= WL/RF derivative of pPP1151), pPP2711, and pPP2802. Ste4–Gpa1 fusions were expressed from derivatives of pPP1150. The Gpa1-QL mutant is defective at GTP hydrolysis. (A) Representative images of the predominant morphologies. (B) Cell morphologies were quantified by blind counting of 200 cells per condition in three separate experiments. Cells were scored as “polarized” if they formed pear-shaped shmoos or elongated to a point at one end; cells were scored as “elongated” if one axis was clearly longer than the other but neither end was pointed. Bars, mean − SD (n = 3). (C) Transcriptional induction. PPY856 (ste4Δ) cells harboring the indicated PGAL1-STE4-GPA1 plasmids (derivatives of pPP1150) were induced with galactose ± α factor. Results for the WT–WT and WL/RF–WT fusion proteins are identical to those for the PGAL1-driven constructs in Figure 7E (bottom, middle and right), and they are shown here for comparison. Bars, mean ± SD (n = 4). (D) Fusion proteins harboring the Gpa1-QL mutation are defective at chemotropism. Mating was assayed ± 20 μM α factor by using strain PPY1230 (ste4Δ gpa1Δ ste5Δ) expressing PGAL1-STE5ΔN-CTM (pPP479) and Ste4-Gpa1 fusions (as in C). (E) Gpa1-QL eliminates the chemotropic advantage of Sw interface mutants over Nt interface mutants. Mating was assayed in strain PPY1230 (ste4Δ gpa1Δ ste5Δ) expressing PGAL1-STE5ΔN-SEC22 (pPP1175) and the indicated combination of Gpa1 (pPP2711, pPP2802) and Ste4 (derivatives of pPP226; vector = pRS316).
Figure 9.
Figure 9.
Model for how Sw and Nt mutants differentially affect dissociation of Gαβγ and receptor coupling. The schematic diagram of the receptor and heterotrimer is based on the molecular model shown in Figure 3A. Zig-zag lines signify membrane-anchoring groups attached to the N terminus of Gα and the C terminus of Gγ. Mutations in either the Sw or Nt interface cause constitutive activation of Gβγ, but the Sw interface mutants remain competent to mediate directional responses to chemoattractant (i.e., chemotropism and de novo polarization), whereas the Nt interface mutants are defective. Alone, contacts in the Nt interface may be insufficient to maintain Gα–Gβ association, but membrane insertion of the adjacent lipophilic groups may stabilize this weak interaction; this could explain why the Sw interface mutants show no Gα interaction in the absence of membranes (e.g., in coimmunoprecipitation and two-hybrid assays), and yet can still mediate responses to pheromone in vivo. Therefore, mutations in the Sw interface are proposed to result in a partially dissociated structure that remains tethered by the Nt interface, and hence remains in regulatory communication with the receptor. See text for further discussion.

Similar articles

Cited by

References

    1. Apanovitch D. M., Iiri T., Karasawa T., Bourne H. R., Dohlman H. G. Second site suppressor mutations of a GTPase-deficient G-protein α-subunit. Selective inhibition of Gβγ-mediated signaling. J. Biol. Chem. 1998;273:28597–28602. - PubMed
    1. Arkowitz R. A. Responding to attraction: chemotaxis and chemotropism in Dictyostelium and yeast. Trends Cell Biol. 1999;9:20–27. - PubMed
    1. Ayscough K. R., Drubin D. G. A role for the yeast actin cytoskeleton in pheromone receptor clustering and signalling. Curr. Biol. 1998;8:927–930. - PubMed
    1. Bagorda A., Mihaylov V. A., Parent C. A. Chemotaxis: moving forward and holding on to the past. Thromb. Haemost. 2006;95:12–21. - PubMed
    1. Bar E. E., Ellicott A. T., Stone D. E. Gbetagamma recruits Rho1 to the site of polarized growth during mating in budding yeast. J. Biol. Chem. 2003;278:21798–21804. - PubMed

Publication types

MeSH terms

Substances

LinkOut - more resources