Global analysis of alternative splicing differences between humans and chimpanzees
- PMID: 17978102
- PMCID: PMC2049197
- DOI: 10.1101/gad.1606907
Global analysis of alternative splicing differences between humans and chimpanzees
Abstract
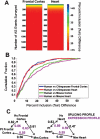
Alternative splicing is a powerful mechanism affording extensive proteomic and regulatory diversity from a limited repertoire of genes. However, the extent to which alternative splicing has contributed to the evolution of primate species-specific characteristics has not been assessed previously. Using comparative genomics and quantitative microarray profiling, we performed the first global analysis of alternative splicing differences between humans and chimpanzees. Surprisingly, 6%-8% of profiled orthologous exons display pronounced splicing level differences in the corresponding tissues from the two species. Little overlap is observed between the genes associated with alternative splicing differences and the genes that display steady-state transcript level differences, indicating that these layers of regulation have evolved rapidly to affect distinct subsets of genes in humans and chimpanzees. The alternative splicing differences we detected are predicted to affect diverse functions including gene expression, signal transduction, cell death, immune defense, and susceptibility to diseases. Differences in expression at the protein level of the major splice variant of Glutathione S-transferase omega-2 (GSTO2), which functions in the protection against oxidative stress and is associated with human aging-related diseases, suggests that this enzyme is less active in human cells compared with chimpanzee cells. The results of this study thus support an important role for alternative splicing in establishing differences between humans and chimpanzees.
Figures


Similar articles
-
Evolution of alternative splicing in primate brain transcriptomes.Hum Mol Genet. 2010 Aug 1;19(15):2958-73. doi: 10.1093/hmg/ddq201. Epub 2010 May 11. Hum Mol Genet. 2010. PMID: 20460271 Free PMC article.
-
Sex-specific and lineage-specific alternative splicing in primates.Genome Res. 2010 Feb;20(2):180-9. doi: 10.1101/gr.099226.109. Epub 2009 Dec 15. Genome Res. 2010. PMID: 20009012 Free PMC article.
-
Conservation, evolution, and regulation of splicing during prefrontal cortex development in humans, chimpanzees, and macaques.RNA. 2018 Apr;24(4):585-596. doi: 10.1261/rna.064931.117. Epub 2018 Jan 23. RNA. 2018. PMID: 29363555 Free PMC article.
-
How prevalent is functional alternative splicing in the human genome?Trends Genet. 2004 Feb;20(2):68-71. doi: 10.1016/j.tig.2003.12.004. Trends Genet. 2004. PMID: 14746986 Review.
-
Alternative splicing: new insights from global analyses.Cell. 2006 Jul 14;126(1):37-47. doi: 10.1016/j.cell.2006.06.023. Cell. 2006. PMID: 16839875 Review.
Cited by
-
Assessing the functional relevance of splice isoforms.NAR Genom Bioinform. 2021 May 22;3(2):lqab044. doi: 10.1093/nargab/lqab044. eCollection 2021 Jun. NAR Genom Bioinform. 2021. PMID: 34046593 Free PMC article.
-
Cuproptosis-Associated lncRNA Gene Signature Establishes New Prognostic Profile and Predicts Immunotherapy Response in Endometrial Carcinoma.Biochem Genet. 2024 Oct;62(5):3439-3466. doi: 10.1007/s10528-023-10574-8. Epub 2023 Dec 18. Biochem Genet. 2024. PMID: 38108937 Free PMC article.
-
Functional implications of novel human acid sphingomyelinase splice variants.PLoS One. 2012;7(4):e35467. doi: 10.1371/journal.pone.0035467. Epub 2012 Apr 27. PLoS One. 2012. PMID: 22558155 Free PMC article.
-
SAPFIR: A webserver for the identification of alternative protein features.BMC Bioinformatics. 2022 Jun 24;23(1):250. doi: 10.1186/s12859-022-04804-w. BMC Bioinformatics. 2022. PMID: 35751026 Free PMC article.
-
Alternative splicing and the evolution of phenotypic novelty.Philos Trans R Soc Lond B Biol Sci. 2017 Feb 5;372(1713):20150474. doi: 10.1098/rstb.2015.0474. Philos Trans R Soc Lond B Biol Sci. 2017. PMID: 27994117 Free PMC article. Review.
References
-
- Ast G. How did alternative splicing evolve? Nat. Rev. Genet. 2004;5:773–782. - PubMed
-
- Bell B., Scheer E., Tora L., Scheer E., Tora L., Tora L. Identification of hTAF(II)80 δ links apoptotic signaling pathways to transcription factor TFIID function. Mol. Cell. 2001;8:591–600. - PubMed
-
- Blencowe B.J. Alternative splicing: New insights from global analyses. Cell. 2006;126:37–47. - PubMed
-
- Brudno M., Gelfand M.S., Spengler S., Zorn M., Dubchak I., Conboy J.G., Gelfand M.S., Spengler S., Zorn M., Dubchak I., Conboy J.G., Spengler S., Zorn M., Dubchak I., Conboy J.G., Zorn M., Dubchak I., Conboy J.G., Dubchak I., Conboy J.G., Conboy J.G. Computational analysis of candidate intron regulatory elements for tissue-specific alternative pre-mRNA splicing. Nucleic Acids Res. 2001;29:2338–2348. - PMC - PubMed
-
- Bustamante C.D., Fledel-Alon A., Williamson S., Nielsen R., Hubisz M.T., Glanowski S., Tanenbaum D.M., White T.J., Sninsky J.J., Hernandez R.D., Fledel-Alon A., Williamson S., Nielsen R., Hubisz M.T., Glanowski S., Tanenbaum D.M., White T.J., Sninsky J.J., Hernandez R.D., Williamson S., Nielsen R., Hubisz M.T., Glanowski S., Tanenbaum D.M., White T.J., Sninsky J.J., Hernandez R.D., Nielsen R., Hubisz M.T., Glanowski S., Tanenbaum D.M., White T.J., Sninsky J.J., Hernandez R.D., Hubisz M.T., Glanowski S., Tanenbaum D.M., White T.J., Sninsky J.J., Hernandez R.D., Glanowski S., Tanenbaum D.M., White T.J., Sninsky J.J., Hernandez R.D., Tanenbaum D.M., White T.J., Sninsky J.J., Hernandez R.D., White T.J., Sninsky J.J., Hernandez R.D., Sninsky J.J., Hernandez R.D., Hernandez R.D., et al. Natural selection on protein-coding genes in the human genome. Nature. 2005;437:1153–1157. - PubMed
Publication types
MeSH terms
Substances
Grants and funding
LinkOut - more resources
Full Text Sources
Other Literature Sources
