

Identification of prostate cancer modifier pathways using parental strain expression mapping
- PMID: 17978178
- PMCID: PMC2077015
- DOI: 10.1073/pnas.0708476104
Identification of prostate cancer modifier pathways using parental strain expression mapping
Abstract
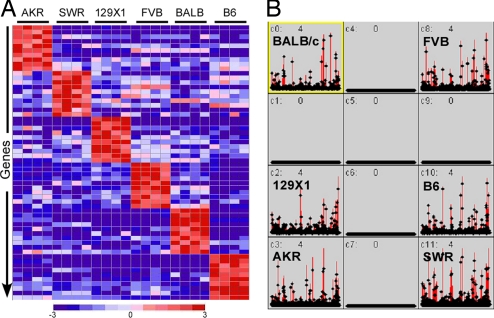
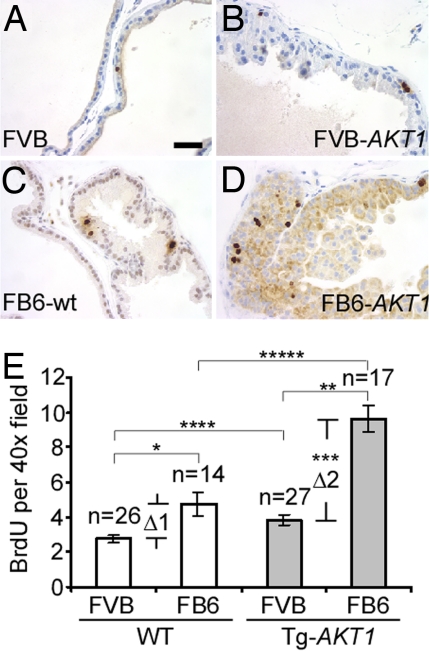
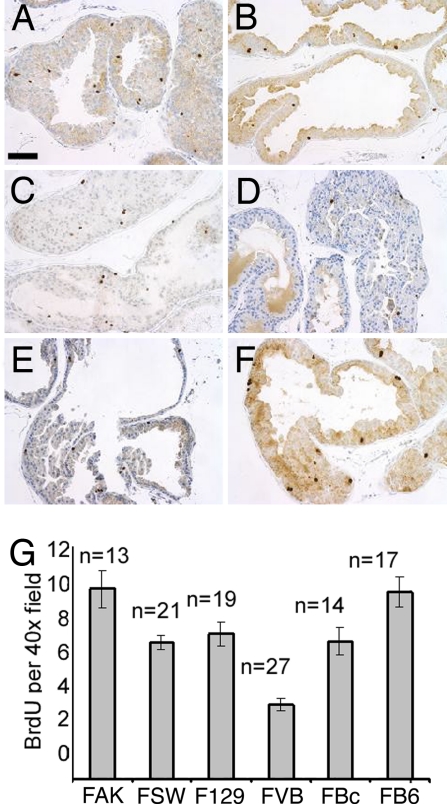
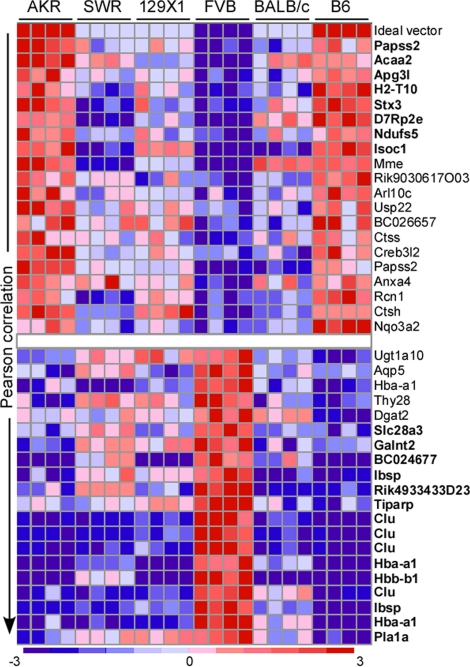
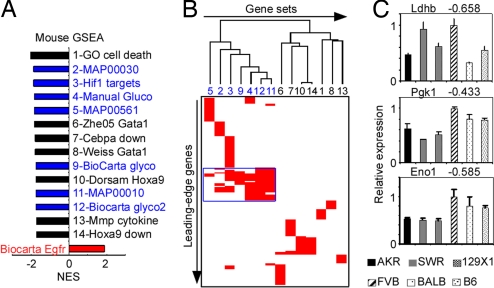
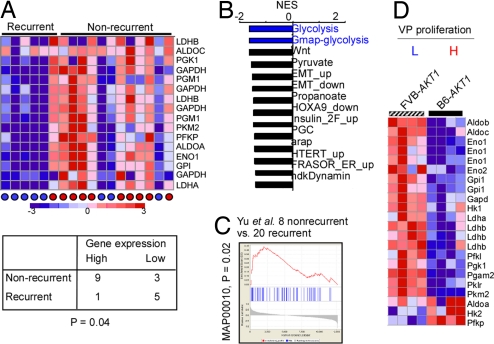
Inherited genetic risk factors play an important role in cancer. However, other than the Mendelian fashion cancer susceptibility genes found in familial cancer syndromes, little is known about risk modifiers that control individual susceptibility. Here we developed a strategy, parental strain expression mapping, that utilizes the homogeneity of inbred mice and genome-wide mRNA expression analyses to directly identify candidate germ-line modifier genes and pathways underlying phenotypic differences among murine strains exposed to transgenic activation of AKT1. We identified multiple candidate modifier pathways and, specifically, the glycolysis pathway as a candidate negative modulator of AKT1-induced proliferation. In keeping with the findings in the murine models, in multiple human prostate expression data set, we found that enrichment of glycolysis pathways in normal tissues was associated with decreased rates of cancer recurrence after prostatectomy. Together, these data suggest that parental strain expression mapping can directly identify germ-line modifier pathways of relevance to human disease.
Conflict of interest statement
The authors declare no conflict of interest.
Figures
Similar articles
-
Modifier locus mapping of a transgenic F2 mouse population identifies CCDC115 as a novel aggressive prostate cancer modifier gene in humans.BMC Genomics. 2018 Jun 11;19(1):450. doi: 10.1186/s12864-018-4827-2. BMC Genomics. 2018. PMID: 29890952 Free PMC article.
-
Expression patterns of candidate susceptibility genes HNF1β and CtBP2 in prostate cancer: association with tumor progression.Urol Oncol. 2014 May;32(4):426-32. doi: 10.1016/j.urolonc.2013.09.006. Epub 2013 Dec 12. Urol Oncol. 2014. PMID: 24332637
-
Genetic background influences murine prostate gene expression: implications for cancer phenotypes.Genome Biol. 2007;8(6):R117. doi: 10.1186/gb-2007-8-6-r117. Genome Biol. 2007. PMID: 17577413 Free PMC article.
-
10 years of mouse cancer modifier loci: human relevance.Cancer Res. 2003 Jun 15;63(12):3011-8. Cancer Res. 2003. PMID: 12810618 Review.
-
Prostate cancer-associated lncRNAs.Cancer Lett. 2018 Apr 1;418:159-166. doi: 10.1016/j.canlet.2018.01.012. Epub 2018 Jan 9. Cancer Lett. 2018. PMID: 29330107 Review.
Cited by
-
Slow disease progression in a C57BL/6 pten-deficient mouse model of prostate cancer.Am J Pathol. 2011 Jul;179(1):502-12. doi: 10.1016/j.ajpath.2011.03.014. Epub 2011 May 7. Am J Pathol. 2011. PMID: 21703427 Free PMC article.
-
PTEN deficiency is fully penetrant for prostate adenocarcinoma in C57BL/6 mice via mTOR-dependent growth.Am J Pathol. 2009 May;174(5):1869-79. doi: 10.2353/ajpath.2009.080055. Am J Pathol. 2009. PMID: 19395652 Free PMC article.
-
Investigating the concordance of Gene Ontology terms reveals the intra- and inter-platform reproducibility of enrichment analysis.BMC Bioinformatics. 2013 Apr 29;14:143. doi: 10.1186/1471-2105-14-143. BMC Bioinformatics. 2013. PMID: 23627640 Free PMC article.
-
ADGR: Admixture-Informed Differential Gene Regulation.Genes (Basel). 2023 Jan 5;14(1):147. doi: 10.3390/genes14010147. Genes (Basel). 2023. PMID: 36672888 Free PMC article.
-
Error control variability in pathway-based microarray analysis.Bioinformatics. 2009 Sep 1;25(17):2216-21. doi: 10.1093/bioinformatics/btp385. Epub 2009 Jun 26. Bioinformatics. 2009. PMID: 19561020 Free PMC article.
References
-
- Sellers WR, Meyerson M. J Natl Cancer Inst. 2005;97:326–328. - PubMed
-
- Landi MT, Bauer J, Pfeiffer RM, Elder DE, Hulley B, Minghetti P, Calista D, Kanetsky PA, Pinkel D, Bastian BC. Science. 2006;313:521–522. - PubMed
-
- Lichtenstein P, Holm NV, Verkasalo PK, Iliadou A, Kaprio J, Koskenvuo M, Pukkala E, Skytthe A, Hemminki K. N Engl J Med. 2000;343:78–85. - PubMed
-
- Risch NJ. Nature. 2000;405:847–856. - PubMed
-
- Flint J, Valdar W, Shifman S, Mott R. Nat Rev Genet. 2005;6:271–286. - PubMed
Publication types
MeSH terms
Substances
Associated data
- Actions
Grants and funding
LinkOut - more resources
Full Text Sources
Medical
Molecular Biology Databases
Miscellaneous
