Beta-catenin mediates alteration in cell proliferation, motility and invasion of prostate cancer cells by differential expression of E-cadherin and protein kinase D1
- PMID: 17979146
- PMCID: PMC2928064
- DOI: 10.1002/jcb.21603
Beta-catenin mediates alteration in cell proliferation, motility and invasion of prostate cancer cells by differential expression of E-cadherin and protein kinase D1
Abstract
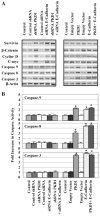
We have previously demonstrated that Protein Kinase D1 (PKD1) interacts with E-cadherin and is associated with altered cell aggregation and motility in prostate cancer (PC). Because both PKD1 and E-cadherin are known to be dysregulated in PC, in this study we investigated the functional consequences of combined dysregulation of PKD1 and E-cadherin using a panel of human PC cell lines. Gain and loss of function studies were carried out by either transfecting PC cells with full-length E-cadherin and/or PKD1 cDNA or by protein silencing by siRNAs, respectively. We studied major malignant phenotypic characteristics including cell proliferation, motility, and invasion at the cellular level, which were corroborated with appropriate changes in representative molecular markers. Down regulation or ectopic expression of either E-cadherin or PKD1 significantly increased or decreased cell proliferation, motility, and invasion, respectively, and combined down regulation cumulatively influenced the effects. Loss of PKD1 or E-cadherin expression was associated with increased expression of the pro-survival molecular markers survivin, beta-catenin, cyclin-D, and c-myc, whereas overexpression of PKD1 and/or E-cadherin resulted in an increase of caspases. The inhibitory effect of PKD1 and E-cadherin on cell proliferation was rescued by coexpression with beta-catenin, suggesting that beta-catenin mediates the effect of proliferation by PKD1 and E-cadherin. This study establishes the functional significance of combined dysregulation of PKD1 and E-cadherin in PC and that their effect on cell growth is mediated by beta-catenin.
Figures


Similar articles
-
E-cadherin phosphorylation by protein kinase D1/protein kinase C{mu} is associated with altered cellular aggregation and motility in prostate cancer.Cancer Res. 2005 Jan 15;65(2):483-92. Cancer Res. 2005. PMID: 15695390
-
Differential expression of epithelial and mesenchymal proteins in a panel of prostate cancer cell lines.J Urol. 2012 Aug;188(2):632-8. doi: 10.1016/j.juro.2012.03.114. Epub 2012 Jun 15. J Urol. 2012. PMID: 22704442
-
Protein kinase D1-mediated phosphorylation and subcellular localization of beta-catenin.Cancer Res. 2009 Feb 1;69(3):1117-24. doi: 10.1158/0008-5472.CAN-07-6270. Epub 2009 Jan 13. Cancer Res. 2009. PMID: 19141652
-
Activation of estrogen receptor beta (ERβ) regulates the expression of N-cadherin, E-cadherin and β-catenin in androgen-independent prostate cancer cells.Int J Biochem Cell Biol. 2018 Mar;96:40-50. doi: 10.1016/j.biocel.2018.01.008. Epub 2018 Jan 16. Int J Biochem Cell Biol. 2018. PMID: 29341930
-
Alterations of the cadherin-catenin cell adhesion system in cancers.Princess Takamatsu Symp. 1994;24:51-62. Princess Takamatsu Symp. 1994. PMID: 8983063 Review.
Cited by
-
Expression Level of Genes Coding for Cell Adhesion Molecules of Cadherin Group in Colorectal Cancer Patients.Med Sci Monit. 2015 Jul 13;21:2031-40. doi: 10.12659/MSM.893610. Med Sci Monit. 2015. PMID: 26167814 Free PMC article.
-
Delineation of the key aspects in the regulation of epithelial monolayer formation.Mol Cell Biol. 2013 Jul;33(13):2535-50. doi: 10.1128/MCB.01435-12. Epub 2013 Apr 22. Mol Cell Biol. 2013. PMID: 23608536 Free PMC article.
-
A transcription co-factor integrates cell adhesion and motility with the p53 response.Proc Natl Acad Sci U S A. 2009 Nov 24;106(47):19872-7. doi: 10.1073/pnas.0906785106. Epub 2009 Nov 6. Proc Natl Acad Sci U S A. 2009. PMID: 19897726 Free PMC article.
-
Effect of artemisinin derivatives on apoptosis and cell cycle in prostate cancer cells.Anticancer Drugs. 2010 Apr;21(4):423-32. doi: 10.1097/CAD.0b013e328336f57b. Anticancer Drugs. 2010. PMID: 20130467 Free PMC article.
-
E-cadherin plasticity in prostate cancer stem cell invasion.Am J Cancer Res. 2011;1(1):71-84. Epub 2010 Oct 20. Am J Cancer Res. 2011. PMID: 21968440 Free PMC article.
References
-
- Aberle H, Butz S, Stappert J, Weissig H, Kemler R, Hoschuetzky H. Assembly of the cadherin-catenin complex in vitro with recombinant proteins. J Cell Sci. 1994;107(Pt 12):3655–3663. - PubMed
-
- ACS (American Cancer Society) Cancer statistics. 2007.
-
- Baron CL, Malhotra V. Role of diacylglycerol in PKD recruitment to the TGN and protein transport to the plasma membrane. Science. 2002;295:325–328. - PubMed
-
- Berx G, Staes K, van Hengel J, Molemans F, Bussemakers MJ, van Bokhoven A, van Roy F. Cloning and characterization of the human invasion suppressor gene E-cadherin (CDH1) Genomics. 1995;26:281–289. - PubMed
-
- Bussemakers MJ, van Moorselaar RJ, Giroldi LA, Ichikawa T, Isaacs JT, Takeichi M, Debruyne FM, Schalken JA. Decreased expression of E-cadherin in the progression of rat prostatic cancer. Cancer Res. 1992;52:2916–2922. - PubMed
MeSH terms
Substances
Grants and funding
LinkOut - more resources
Full Text Sources
Medical

