Quantitative proteomics of intracellular Porphyromonas gingivalis
- PMID: 17979175
- PMCID: PMC2660851
- DOI: 10.1002/pmic.200700543
Quantitative proteomics of intracellular Porphyromonas gingivalis
Abstract
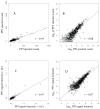
Whole-cell quantitative proteomic analyses were conducted to investigate the change from an extracellular to intracellular lifestyle for Porphyromonas gingivalis, a Gram-negative intracellular pathogen associated with periodontal disease. Global protein abundance data for P. gingivalis strain ATCC 33277 internalized for 18 h within human gingival epithelial cells and controls exposed to gingival cell culture medium were obtained at sufficient coverage to provide strong evidence that these changes are profound. A total of 385 proteins were overexpressed in internalized P. gingivalis relative to controls; 240 proteins were shown to be underexpressed. This represented in total about 28% of the protein encoding ORFs annotated for this organism, and slightly less than half of the proteins that were observed experimentally. Production of several proteases, including the classical virulence factors RgpA, RgpB, and Kgp, was decreased. A separate validation study was carried out in which a 16-fold dilution of the P. gingivalis proteome was compared to the undiluted sample in order to assess the quantitative false negative rate (all ratios truly alternative). Truly null (no change) abundance ratios from technical replicates were used to assess the rate of quantitative false positives over the entire proteome. A global comparison between the direction of abundance change observed and previously published bioinformatic gene pair predictions for P. gingivalis will assist with future studies of P. gingivalis gene regulation and operon prediction.
Figures


Similar articles
-
Pathway analysis for intracellular Porphyromonas gingivalis using a strain ATCC 33277 specific database.BMC Microbiol. 2009 Sep 1;9:185. doi: 10.1186/1471-2180-9-185. BMC Microbiol. 2009. PMID: 19723305 Free PMC article.
-
Differential protein expression by Porphyromonas gingivalis in response to secreted epithelial cell components.Proteomics. 2005 Jan;5(1):198-211. doi: 10.1002/pmic.200400922. Proteomics. 2005. PMID: 15619293 Free PMC article.
-
Global analysis of lysine succinylome in the periodontal pathogen Porphyromonas gingivalis.Mol Oral Microbiol. 2019 Apr;34(2):74-83. doi: 10.1111/omi.12255. Epub 2019 Feb 18. Mol Oral Microbiol. 2019. PMID: 30672658
-
Mass spectrometry-based proteomics and its application to studies of Porphyromonas gingivalis invasion and pathogenicity.Infect Disord Drug Targets. 2006 Sep;6(3):311-25. doi: 10.2174/187152606778249935. Infect Disord Drug Targets. 2006. PMID: 16918489 Free PMC article. Review.
-
Porphyromonas gingivalis gingipains: the molecular teeth of a microbial vampire.Curr Protein Pept Sci. 2003 Dec;4(6):409-26. doi: 10.2174/1389203033487009. Curr Protein Pept Sci. 2003. PMID: 14683427 Review.
Cited by
-
The serine phosphatase SerB of Porphyromonas gingivalis suppresses IL-8 production by dephosphorylation of NF-κB RelA/p65.PLoS Pathog. 2013;9(4):e1003326. doi: 10.1371/journal.ppat.1003326. Epub 2013 Apr 18. PLoS Pathog. 2013. PMID: 23637609 Free PMC article.
-
What are We Learning and What Can We Learn from the Human Oral Microbiome Project?Curr Oral Health Rep. 2016 Mar;3(1):56-63. doi: 10.1007/s40496-016-0080-4. Epub 2016 Jan 23. Curr Oral Health Rep. 2016. PMID: 27152251 Free PMC article.
-
Investigation of the Cell Surface Proteome of Human Periodontal Ligament Stem Cells.Stem Cells Int. 2016;2016:1947157. doi: 10.1155/2016/1947157. Epub 2016 Aug 4. Stem Cells Int. 2016. PMID: 27579043 Free PMC article.
-
Genetic exchange of fimbrial alleles exemplifies the adaptive virulence strategy of Porphyromonas gingivalis.PLoS One. 2014 Mar 13;9(3):e91696. doi: 10.1371/journal.pone.0091696. eCollection 2014. PLoS One. 2014. PMID: 24626479 Free PMC article.
-
Proteomics of Fusobacterium nucleatum within a model developing oral microbial community.Microbiologyopen. 2014 Oct;3(5):729-51. doi: 10.1002/mbo3.204. Epub 2014 Aug 25. Microbiologyopen. 2014. PMID: 25155235 Free PMC article.
References
Publication types
MeSH terms
Substances
Grants and funding
LinkOut - more resources
Full Text Sources
Molecular Biology Databases

