. 2007 Nov 29;111(47):13419-35.
doi: 10.1021/jp074285e. Epub 2007 Nov 3.

Specificity in molecular design: a physical framework for probing the determinants of binding specificity and promiscuity in a biological environment

Affiliations

Specificity in molecular design: a physical framework for probing the determinants of binding specificity and promiscuity in a biological environment

Mala L Radhakrishnan et al. J Phys Chem B. .

Abstract

Binding specificity is an important consideration in drug design. An effective drug molecule often must bind with high specificity to its intended target in the body; lower specificity implies the possibility of significant binding to unintended partners, which could instigate deleterious side effects. However, if the target is a rapidly mutating agent, a drug that is too specific will quickly lose its efficacy by not binding well to functional mutants. Therefore, in molecular design, it is crucial to tailor the binding specificity of a drug to the problem at hand. In practice, specificity is often studied on a case-by-case basis, and it is difficult to create general understanding of the determinants of specificity from the union of such available cases. In this work, we undertook a comprehensive, general study of molecular binding with emphasis on understanding the determinants of specificity from a physical standpoint. By extending a theoretical framework grounded in continuum electrostatics and creating an abstracted lattice model that captures key physical aspects of binding interactions, we systematically explored the relationship between a molecule's physical characteristics and its binding specificity toward potential partners. The theory and simulated binding interactions suggested that charged molecules are more specific binders than their hydrophobic counterparts for several reasons. First, the biological spectrum of possible binding characteristics includes more partners that bind equally well to hydrophobic ligands than to charged ligands. Also, charged ligands, whose electrostatic potentials have strong orientational dependence, are more sensitive to shape complementarity than their hydrophobic counterparts. Ligand conformational and orientational flexibility can further influence a charged molecule's ability to bind specifically. Interestingly, we found that conformational flexibility can increase the specificity of polar and charged ligands, by allowing them to greatly lower the binding free energy to a select few partners relative to others. Additionally, factors such as a molecule's size and the ionic strength of the solution were found to predictably affect binding specificity. Taken together, these results, all of which stem from a unified theoretical framework, provide valuable physical insight into the general determinants of binding specificity and promiscuity in a biological environment. The general principles discussed here could prove useful in the design of molecules with tailored specificities, leading to more effective therapeutics.


Figures

Figure 1
Figure 1
(a) Graphical representation of the promiscuity metric; the ligand represented here has a promiscuity of 4. (b), (c) The binding profiles of two hypothetical ligands toward an infinite panel of identically-shaped receptors, using a continuum electrostics framework. for ease of visualization, the receptors have only one charged atom so that a ligand’s binding profile is a function of only one value. The profile shown in (b) represents a more promiscuous ligand that that shown in (c). The dotted line in each indicates the possible receptors that can contribute to each ligand’s promiscuity, using a 3 kcal/mol threshold, Π3.
Figure 2
Figure 2
Sample model molecules. A bound model ligand and receptor are shown in yellow and green, respectively. The model molecules represent portions of a biological ligand-receptor interface. The spheres marked with ‘*’ on the receptor were allowed to bear charge in the numerical simulations. All ligand atoms could bear charge.
Figure 3
Figure 3
Theory and results for the control system: (a) Binding free energy profiles for two hypothetical ligands differing in charge and binding in fixed orientation to identically-shaped receptors. Though these ligand have different absolute affinities to the panel of receptors, they have identical promiscuities (π3), as shown by the black horizontal lines. This plot shows the hypothetical electrostatic binding affinity, but as the shapes of all receptors and complexes are identical, the van der Waals and SASA contributions will not contribute toward promiscuity. (b) Plot of promiscuity vs. ligand hydrophilicity (as measured by desolvation penalty) for 625 simulated ligands varying only in charge and binding to simulated receptors meant to recreate the space described in (a). (c) The results in (b) (black + ’s) are compared to ones in which the two receptor rods marked with a ‘*’ in Fig. 2 were translated 0.3 Å closer to the ligand, thus increasing receptor desolvation by the ligand (gray o’s). As the R matrix for this new system has larger elements, the ligands are all more specific toward their panel of receptors. (d) Ligand coverage (C−3) is plotted against its desolvation penalty. In this control system, highly charged and polar ligands are able to bind to many receptors with high affinity, when compared to hydrophobic ligands. Chapter 3 provides the theoretical framework for understanding why this is the case in this system.
Figure 4
Figure 4
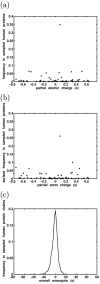
Three qualitative methods were used to estimate the magnitudes and distribution of charge values in proteins (a) Estimated frequencies of partial atomic charge values in human proteins. (b) Estimated frequencies of partial atomic charges at protein surfaces. (c) Estimated monopole frequencies of human protein sequences.
Figure 5
Figure 5
Effect of adding bounds to receptor charge space. (a) The vertical lines represent bounds that lower the number of competing receptors for a highly charged/polar ligand (represented by solid-line parabola) more than it does for an uncharged ligand (represented by dashedline parabola). Therefore, polar/charged ligands are less promiscuous in a symmetrically bounded space. (b) Numerical experiment showing the promiscuities of model ligands varying only in charge and rigidly binding to identically-shaped model receptors in a bounded charge space. (c) Same as (b), except the receptor charge space at the two basis points is sampled from the distribution shown in Figure 4b. (d) C−3, values are plotted against ligand desolvation penalty. The receptor panel used was the same as that used to generate the results shown in (b). Now that the receptor charge space is bounded, the charged and polar receptors are able to bind to few receptors with high affinity, unlike those analyzed in Figure 3d.
Figure 6
Figure 6
Effect of having multiple receptor shapes and charge distributions in the system: (a-b) Schematic electrostatic binding profiles of a hypothetical hydrophobic ligand (a) and charged ligand (b) to three differently-shaped sets of receptors. Each parabola represents the electrostatic binding profile toward identically shaped receptors varying in charge; there are three different shapes of receptors, leading to the three different parabolas. Note that the hydrophobic ligand has far more receptors in the space within b kcal/mol from the best binder — all three receptor shapes contribute to its promiscuity, and it is more promiscuous. Only two receptor shapes (represented by the solid and dotted parabolas) contribute to the promiscuity of the charged ligand, and it is therefore less promiscuous. (c) Plot of promiscuity vs. ligand desolvation penalty for ligands varying linearly in their charge distribution and binding rigidly to receptors varying both in their shape and charge distribution (in an unbounded charge space). Only the electrostatic component of binding was calculated in this plot. (d) Promiscuities of the 625 model ligands toward the ensemble of differently-shaped and -charged receptors are plotted against ligand desolvation penalty. Here, the full energy function was used.
Figure 7
Figure 7
Thermodynamic cycle used for computing the total deformation energy of ligands. ΔGdeform0 was found by taking the sum over all other ΔG0’s indicated in the cycle. Solvation and Coulombic matrices were generated to compute the charge-dependent portions of the cycle. The charge independent portion consisted of van der Waals, SASA, and internal energy contributions.
Figure 8
Figure 8
(a) Promiscuities toward a receptor ensemble (whose members differ in both shape and charge) when ligands and bound states are conformationally flexible (blue) and rigid (red), plotted against their desolvation penalties. (b) Promiscuities when ligands and bound states are conformationally flexible (blue and green) and rigid (red), except now, flexible ligands are not allowed to have any unfavorable van der Waals interactions with receptors upon binding. Ligands with high flexibility (internal constant = 0.25 kcal/Å2) are shown in green, and those with moderate flexibility (internal constant = 5 kcal/Å2) are in blue. (c) C−3 values for conformationally flexible (blue) and rigid (red) ligands.
Figure 9
Figure 9
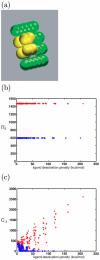
(a) Representation of the larger ligand molecules used to study the effect of ligand size on promiscuity. These ligands were composed of eight spheres. The first four were located identically to those in the control ligand. The second four were offset by 4 Å above the others, and by 1.5 Å along the bonding axis. These locations were chosen such that the added spheres would highly desolvate the receptor upon binding, such that large differences in the promiscuity values could be seen. (b) The π3 values for two sets of ligands toward the same receptor set, plotted against each ligands desolvation energy. One set (red) is composed of “small” ligands, made up of four model atoms. The other set (blue) is composed of larger ligands, of shape shown in (a). This data supports the theoretical prediction that generally, smaller molecules are more promiscuous than large ligands toward the same receptor set. (c) C−3 values are shown for each of the smaller (red) and larger (blue) ligands. Few of the larger ligands are able to bind with high affinity to many of the receptors in the panel.
Figure 10
Figure 10
The π3 values for ligands plotted against ligand desolvation free energy. Here, the receptor set consists of 144 different shapes and an “unbounded” charge space for each shape. Systems with ionic strengths of 0.0 M (red) and 0.145 M (blue) are plotted. For ease of comparison, the desolvation energy plotted for both systems is the desolvation energy in an ionic strength of 0.0 M.
Figure 11
Figure 11
Effect of ligand orientational freedom (multiple binding modes): (a) Free energy paraboloids for multiple binding orientations of a hypothetical ligand to a set of identically-shaped receptors in an unbounded charge space. The thick, solid trace represents the zero temperature limit of the binding energy of the ligand to receptors bearing the corresponding charge distrbutions. This ligand is able to achieve increased promiscuity by binding to members of the receptor panel in two distinct modes. (b) Plot of promiscuity against ligand hydrophilicity for model ligands allowed to bind in shape-invariant orientations to a set of identically-shaped receptors in an unbounded charge space.
Figure 12
Figure 12
(a) π3 of ligands plotted against their desolvation energies (when in the conformation taken by their rigid counterparts). In this system, ligands and bound states are conformationally flexible, and ligands can bind in any of four orientations to receptors, as described in the text. The receptors have bounded charge magnitudes at each basis point and differ in shape, also as described in the text. The ionic strength is 0.145M. The total number of receptors in the system is 82,944. Some of the most hydrophobic receptors have promiscuity values of 82,944 - that is, they bind to all receptors in the space with affinities that lie within a 3 kcal/mol spread. (b) C−3 is plotted against ligand desolvation penalty for this system.

Similar articles

Cited by

References

    1. Scapin G. Curr Drug Targets. 2006;7:1443–1454. - PubMed
    1. Freire E. Nat Biotechnol. 2002;20:15–16. - PubMed
    1. Jakubowski H, Goldman E. Microbiol. Rev. 1992;56:412–429. - PMC - PubMed
    1. Voet D, Voet JG. Biochemistry. 2nd Ed. Wiley; New York: 1995.
    1. Lee JW, Beebe K, Nangle LA, Jang J, Longo-Guess CM, Cool SA, Davisson MT, Sundberg JP, Schimmel P, Ackerman SL. Nature. 2006;443:50–55. - PubMed

Publication types