Review
. 2007 Dec;220(1):169-82.
doi: 10.1111/j.1600-065X.2007.00563.x.

The trafficking of natural killer cells

Affiliations
Review

The trafficking of natural killer cells

Claude Grégoire et al. Immunol Rev. 2007 Dec.

Abstract

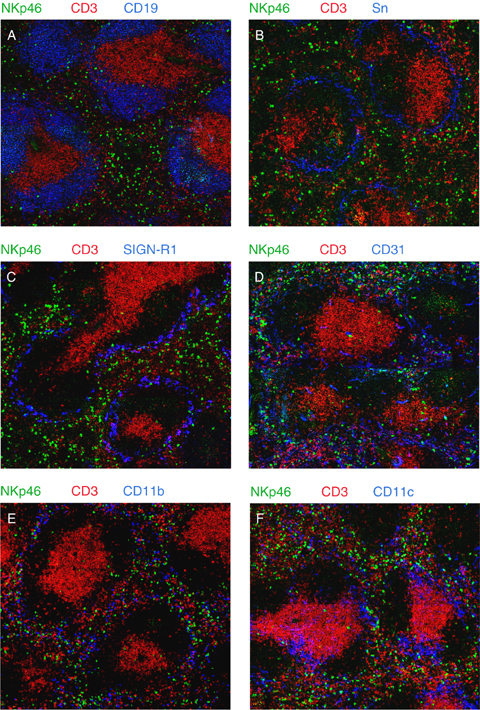
Natural killer (NK) cells are large granular lymphocytes of the innate immune system that participate in the early control of microbial infections and cancer. NK cells can induce the death of autologous cells undergoing various forms of stress, recognizing and providing non-microbial 'danger' signals to the immune system. NK cells are widely distributed in lymphoid and non-lymphoid organs. NK cell precursors originate from the bone marrow and go through a complex maturation process that leads to the acquisition of their effector functions, to changes in their expression of integrins and chemotactic receptors, and to their redistribution from the bone marrow and lymph nodes to blood, spleen, liver, and lung. Here, we describe the tissue localization of NK cells, using NKp46 as an NK cell marker, and review the current knowledge on the mechanisms that govern their trafficking in humans and in mice.


Figures

Figure 1
Figure 1
Tissue distribution of natural killer (NK), NK1.1+ T, and T cells. Lymphocyte populations were isolated from the indicated organs of 6‐week‐old C57BL/6 female mice, as previously described (33). (A) The percentage of NK1.1+CD3 (NK cells), NK1.1+CD3+ (NK1.1+ T cells), and NK1.1CD3+ (mature T cells) cells was measured by flow cytometry. (B) Cell numbers of the indicated subsets were obtained by multiplying the respective frequency of each subset by the total number of lymphocytes in the organ. For blood and lymph nodes, we used an estimate number of 10 million cells in peripheral blood mononuclear cells and 100 million cells in LNs. Results show the mean±standard deviation (SD) of six mice for each organ.
Figure 2
Figure 2
Localization of natural killer (NK) cells in the spleen. Frozen sections of spleen were fixed with acetone and stained with fluorescently coupled antibodies or biotinylated antibodies revealed with fluorochrome‐coupled streptavidin. Anti‐CD3 (145‐2C11), anti‐CD19 (1D3), anti‐CD31 (MEC13‐3), anti‐CD11b (M1/70), and anti‐CD11c (HL3) monoclonal antibodies were from BD Pharmingen (San Diego, CA, USA). Anti‐sialoadhesin (MOMA‐1 for metallophilic macrophages) and anti‐Sign‐R1 (ER‐TR9 for marginal zone macrophages) monoclonal antibodies were obtained from AbD Serotec (Raleigh, NC, USA) and BMA Biomedicals (Augst, Switzerland), respectively. Polyclonal goat anti‐NKp46 (R&D Systems, Minneapolis, MN, USA) was revealed with donkey‐anti‐goat antibody (Invitrogen, Carlsbad, CA, USA), Sections were visualized by confocal microscopy (Zeiss LSM 510 META, Iena, Germany). Panels A–F show representative images for the indicated staining.
Figure 3
Figure 3
Recirculation of natural killer (NK) cells. C57BL/6 spleen cells were labeled with 3 μM 5‐(and 6‐)‐carboxyfluorescein succinimidyl ester (CFSE) and injected retro‐orbitally to C57BL/6 recipient mice. One day after transfer, lymphocyte populations were isolated from the indicated organs. The percentage of NK1.1+CD3 (NK cells) and NK1.1+CD3+ (NK1.1+ T cells) in gated CFSE+ (transferred) and CFSE (recipient) cells was measured by flow cytometry. Results are the mean of six transferred mice in two independent experiments.
Figure 4
Figure 4
Expression of CXCR6 and CX3CR1 by mouse natural killer (NK) cell subsets. Spleen cells from CXCR6gfp/gfp and CX3CR1gfp/gfp knockin mice were stained for CD3, NK1.1, CD11b, and CD27 and analyzed by flow cytometry. Left panel shows the representative expression of CD11b and CD27 in gated NK1.1+CD3 NK cells. NK cell subsets were gated as indicated and CXCR6‐GFP or CX3CR1‐GFP was measured. Results shown are representative of three mice in each group.
Figure 5
Figure 5
Expression of chemotactic receptors by natural killer (NK) cells. The pattern of expression of chemotactic receptors displayed by human (top) and mouse (bottom) NK cell subsets is based on the reported expression at the protein level by flow cytometry or at the mRNA level using microarray experiments (see references in text). Chemokine aliases: CCL19: ELC, CCL21: SLC, CCL3: MIP1‐α, CCL4: MIP1‐β, CCL5: RANTES, CCL2: MCP1, CCL8: MCP2, CCL7: MCP3, CCL13: MCP4, CXCL12: SDF1, CXCL9: MIG, CXCL10: IP10, CXCL11: I‐TAC, CXCL8: IL‐8, CXCL6: GCP‐2, CX3CL1: fractalkine.
Figure 6
Figure 6
Model of mouse natural killer (NK) cell circulation at steady state. NK cells develop mostly in the bone marrow (BM) and, for the CD127+ fraction, also in lymph node (LN) and thymus. NK cells mature from the CD11bdull stage to the double positive CD11bhighCD27high (DP) and further to the CD27dull stage in all organs, starting in the BM (vertical dotted arrows). Upon maturation, they acquire S1P5 expression and exit the BM in a S1P5‐dependent manner. In this model, the more NK cells express S1P5, the more they exit the BM. Once in the periphery, they may return to BM and LN, through a CD62L‐dependent mechanism for the LN.
Figure 7
Figure 7
Relocalization of natural killer (NK) cells in the spleen in response to Con‐A injection. C57BL/6 mice were treated with indicated stimuli [Con‐A, Sigma (St. Louis, MO, USA): 300 μg i.v., lipopolysaccharide (LPS), Sigma (St. Louis, MO, USA), 25 μg i.v.] for the indicated times. Frozen sections of spleen were fixed with acetone and stained with anti‐CD3, anti‐CD19, (panel A, C) or anti‐CD31 and goat anti‐NKp46 antibodies (panel B, D), and goat anti‐NKp46 antibodies, as described in Fig. 2. Sections were visualized by confocal microscopy.
Figure 8
Figure 8
Kinetics of natural killer (NK) cell response to Con‐A injection. C57BL/6 mice were treated with Con‐A (300 μg) and sacrificed at the indicated times. Frozen sections of spleen were fixed with acetone and stained with anti‐sialoadhesin and goat anti‐NKp46 antibodies, as described in Fig. 2. Sections were visualized by confocal microscopy.

References

    1. Moretta A, Bottino C, Mingari MC, Biassoni R, Moretta L. What is a natural killer cell? Nat Immunol 2002;3:6–8. - PubMed
    1. Raulet DH. Interplay of natural killer cells and their receptors with the adaptive immune response. Nat Immunol 2004;5:996–1002. - PubMed
    1. Cerwenka A, Lanier LL. Ligands for natural killer cell receptors: redundancy or specificity. Immunol Rev 2001;181:158–169. - PubMed
    1. Vilches C, Parham P. KIR: diverse, rapidly evolving receptors of innate and adaptive immunity. Annu Rev Immunol 2002;20:217–251. - PubMed
    1. Vivier E, Nunès JA, Vély F. Natural killer cell signaling pathways. Science 2004;306:1517–1519. - PubMed

Publication types

Substances