. 2007 Nov;27(5):711-22.
doi: 10.1016/j.immuni.2007.09.007. Epub 2007 Nov 1.

S-S synapsis during class switch recombination is promoted by distantly located transcriptional elements and activation-induced deaminase

Affiliations

S-S synapsis during class switch recombination is promoted by distantly located transcriptional elements and activation-induced deaminase

Robert Wuerffel et al. Immunity. 2007 Nov.

Abstract

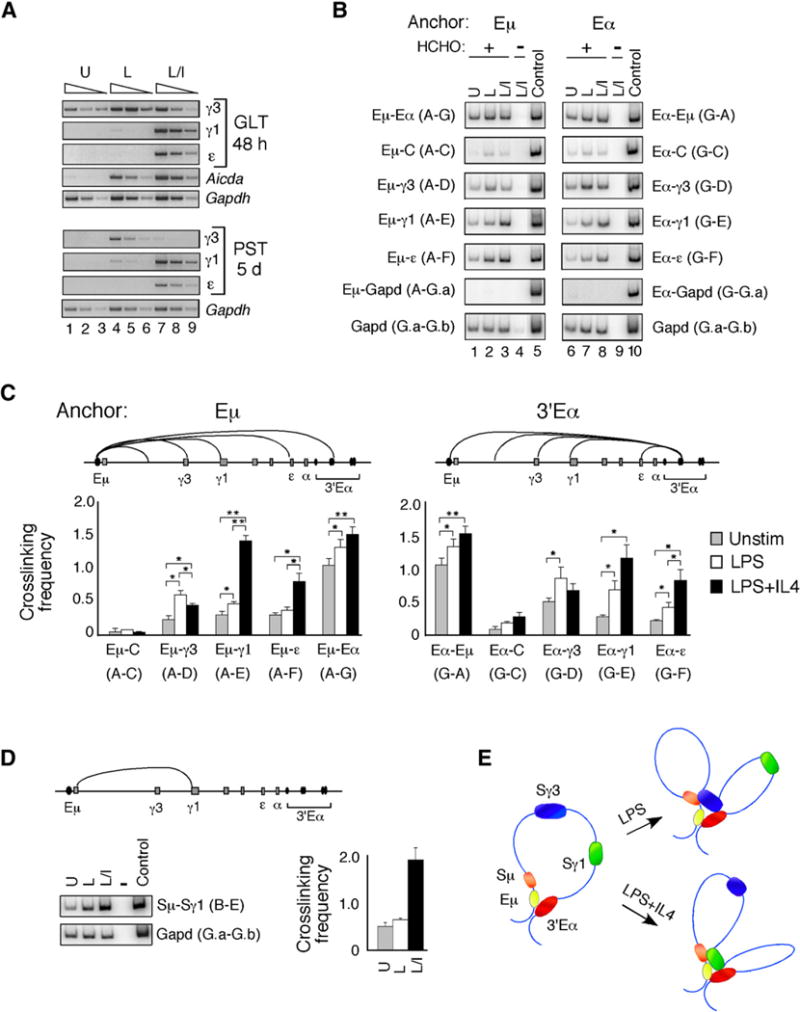
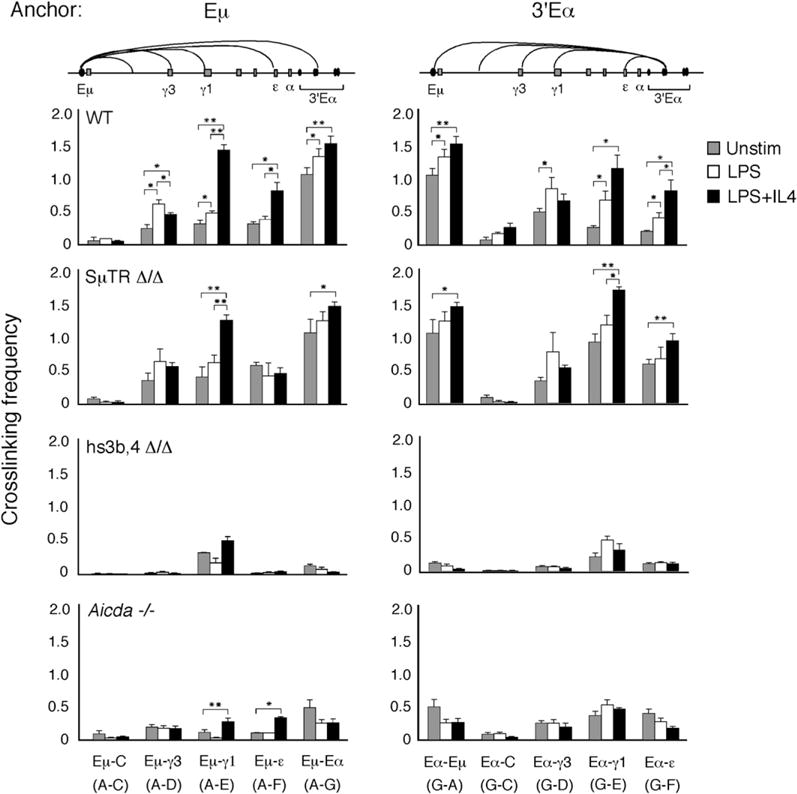
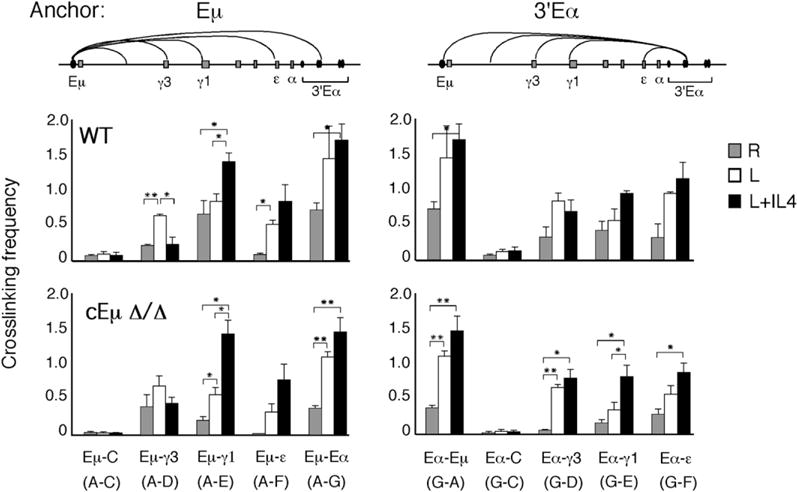
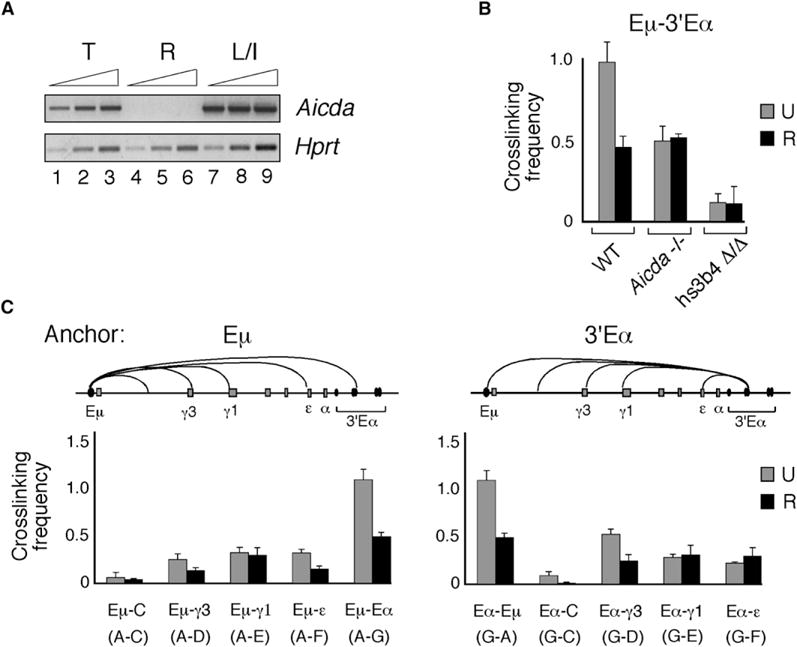
Molecular mechanisms underlying synapsis of activation-induced deaminase (AID)-targeted S regions during class switch recombination (CSR) are poorly understood. By using chromosome conformation capture techniques, we found that in B cells, the Emicro and 3'Ealpha enhancers were in close spatial proximity, forming a unique chromosomal loop configuration. B cell activation led to recruitment of the germline transcript (GLT) promoters to the Emicro:3'Ealpha complex in a cytokine-dependent fashion. This structure facilitated S-S synapsis because Smicro was proximal to Emicro and a downstream S region was corecruited with the targeted GLT promoter to Emicro:3'Ealpha. We propose that GLT promoter association with the Emicro:3'Ealpha complex creates an architectural scaffolding that promotes S-S synapsis during CSR and that these interactions are stabilized by AID. Thus, the S-S synaptosome is formed as a result of the self-organizing transcription system that regulates GLT expression and may serve to guard against spurious chromosomal translocations.


Conflict of interest statement

The authors declare that they have no competing financial interests.

Figures

Figure 1
Figure 1. B Cell-Specific Association of the Eμ and 3′Eα Enhancers and Looping of the Intervening Igh Locus
(A) The 3′ portion of the Igh locus containing CH genes spans 220 kb (Chevillard et al., 2002). HindIII restriction fragments (A–G) used in the 3C assays are shown. Primers are indicated by arrows above and below each fragment. (B) The Gapd locus is shown, and HindIII restriction fragments G.a and G.b are 3.5 kb apart. (C) The equation used to calculate the relative crosslinking frequency between two Igh restriction fragments (XIgH). SIgH is the signal obtained with primer pairs for two different Igh restriction fragments, and SGapd is the signal obtained with primer pairs for the Gapd locus fragments G.a and G.b. This calculation gives the relative crosslinking frequency for each cell type or activation state and corrects for differences in PCR amplification efficiencies, crosslinking and ligation efficiencies, the amounts of template used, and the size of the PCR products. (D) Representative examples of chromosome conformation capture (3C) assays of the Igh locus are shown. Primer pairs for Igh locus fragments A and G and Gapd fragments G.a and G.b were used in PCR to detect amplification products from crosslinked templates derived from unstimulated (U) and LPS+IL4 (L+I)-stimulated B cells (lanes 1 and 2), unstimulated (U) and ConA-stimulated splenic T cells (lanes 3 and 4), no template (lane 5), and control mix (lane 6). PCR was carried out in the presence of [α-32P]dCTP, and products were resolved by 6% PAGE in TBE and then were quantitated by phosphorimaging. (E) The relative crosslinking frequencies observed in splenic B cells that were unstimulated (U) or activated with LPS (L) or LPS+IL4 (L+IL4) and splenic T cells that were unstimulated (U) or activated with ConA are shown (left). Templates were prepared in the presence or absence of formaldehyde (HCHO) as indicated. A schematic is shown of the looped Igh locus in which the Eμ and 3′Eα enhancers interact (right). (F) Chromatin templates from unstimulated splenic B cells were analyzed for relative crosslinking frequencies between anchor fragment A (Eμ) and fragments C–G (left) and between anchor fragment G (3′Eα) and fragments A and C–F (right). The average relative crosslinking frequencies were derived from at least three independent chromatin preparations, and each sample was PCR amplified in duplicate at least twice and SEMs are shown. The crosslinking frequency of the two neighboring Gapd fragments (3.5 kb apart) is arbitrarily assigned the value of 1. Scaling on the y axis permits direct comparison with all other figures.
Figure 2
Figure 2. Locus-Wide 3C Assays Indicate that Recruitment of a GLT Promoter to the Eμ-3′Eα Enhancers Is Correlated with Transcription Activation
(A) GLTs (top) and post-switch transcripts (PSTs) (bottom) were analyzed by semiquantitative RT-PCR with cDNAs derived from splenic B cells that were unstimulated or activated with LPS or LPS+IL4 for 48 hr (GLTs) and 5 days (PSTs). Gapd PCR products were harvested after 30 cycles (lanes 1, 4, 7), 28 cycles (lanes 2, 5, 8), and 26 cycles (lanes 3, 6, 9). GLT, Aicda, and PST PCR products were harvested after 33 cycles (lanes 1, 4, 7), 31 cycles (lanes 2, 5, 8), or 29 cycles (lanes 3, 6, 9). (B) B cells were unstimulated (U) or activated with LPS (L) or LPS+IL4 (L+I) for 48 hr, and chromatin templates were prepared in the presence or absence of formaldehyde (HCHO) as indicated. Representative examples of crosslinking in B cells between anchors Eμ and 3′Eα (fragments A and G) with each other and with all other fragments (C–F) in the Igh locus are shown. Crosslinking between each of the anchors Eμ and 3′Eα (fragments A and G) with the Gapd fragment G.a is shown. Amplification of the control mix containing all combinations of ligated fragments is shown for each primer pair. (C and D) The average relative crosslinking frequencies were derived from at least three independent chromatin preparations and each sample was PCR amplified in duplicate at least twice and SEMs are shown. (C) Chromatin templates from unstimulated, LPS−, or LPS+IL4-activated splenic B cells were analyzed for relative crosslinking frequencies between anchor fragment A (Eμ) and the rest of the locus fragments (C–G) (left) and between anchor fragment G (3′Eα) and the rest of the locus fragments (A, C–F) (right). Student’s t test was used to determine the significance of the different levels of crosslinking frequencies in chromatin samples (*p < 0.05; **p < 0.001). (D) Chromatin templates from unstimulated, LPS−, or LPS+IL4-activated splenic B cells were analyzed for relative crosslinking frequencies between anchor fragment B (Sμ) and fragment E (γ1). (E) A schematic illustrating the long-range interactions between the Eμ and 3′Eα elements of the Igh locus in mature B cells. After B cell activation with LPS, the γ3 GLT promoter is recruited to the Eμ:3′Eα complex. Alternatively, LPS+IL4 stimulation triggers the interaction of the γ1 GLT promoter with the with the Eμ:3′Eα enhancer hub.
Figure 3
Figure 3. Interaction of Eμ and 3′Eα with Each Other and with GLT Promoters Does Not Require the Sμ Region but Is Dependent on the Integrity of the 3′Eα Enhancer and AID Expression
Relative crosslinking frequencies for three to six independent chromatin template preparations are shown for splenic B cells from WT, SμTR Δ/Δ, 3′Eα hs3b,4 Δ/Δ, and Aicda−/− mice that were unstimulated or activated with LPS alone or LPS+IL4 for 48 hr. Eμ or 3′Eα hs1,2 were used as anchor fragments that were used together with fragments from the rest of the locus, as indicated. Preparations of templates from C57BL/6 and C57BL/6×129 WT mice gave the same relative crosslinking values, and analyses were amalgamated here. Data represent standard errors of the mean values. Student’s t test was used to determine the significance of the different crosslinking frequencies in chromatin samples (*p < 0.05; **p < 0.001).
Figure 4
Figure 4. Eμ:3′Eα Complex Formation and Recruitment of GLT Promoters Is Not Dependent on the cEμ Enhancer Element
Relative crosslinking frequencies for two independent chromatin template preparations are shown for CD43 resting splenic B cells (R) from WT and cEμ Δ/Δ mice (129Sve strain) that were unstimulated or activated with LPS alone or LPS+IL4 for 48 hr. Eμ and 3′Eα hs1,2 were used as anchor fragments (A and G) that were used along with fragments from the rest of the locus, as indicated. Data represent standard errors of the mean values. Student’s t test was used to determine the significance of the different crosslinking frequencies in chromatin samples (*p < 0.05; **p < 0.001).
Figure 5
Figure 5. AID Expression Augments the Association of the Eμ Enhancer and 3′Eα LCR Elements
Unstimulated splenic B cell preparations (U) were obtained from B cell enrichment columns whereas resting splenic B cells (R) were isolated by sorting for CD43 B cells (Experimental Procedures). (A) RT-PCR with cDNAs derived from unstimulated total splenic (T) B cells and CD43 resting (R) B cells. Hprt PCR products were harvested after 27 cycles (lanes 1, 4, 7), 29 cycles (lanes 2, 5, 8), and 31 cycles (lanes 3, 6, 9). AID PCR products were harvested after 33 cycles (lanes 1, 4, 7), 35 cycles (lanes 2, 5, 8), and 37 cycles (lanes 3, 6, 9). (B and C) The average crosslinking frequencies along with SEMs were plotted on a scale where a value of 1 corresponds to the crosslinking frequency between the two neighboring Gapd fragments, G.a and G.b. (B) Three independent chromatin template preparations were isolated from WT, Aicda−/−, and hs3b,4 Δ/Δ mice. Chromatin templates were prepared from unstimulated (U) and resting (R) splenic B cells, and crosslinking frequencies were determined for fragments A (Eμ) and G (3′Eα) and Gapd fragments G.a and G.b. (C) Chromatin templates from unstimulated (U) and CD43 resting (R) splenic B cells from WT mice were analyzed for crosslinking frequencies between anchor fragment A (Eμ) and the rest of the Igh locus fragments (C–G) (left) and between anchor fragment G (3′Eα) and the rest of the locus fragments (A, C–F) (right).

Similar articles

Cited by

References

    1. Aten JA, Stap J, Krawczyk PM, van Oven CH, Hoebe RA, Essers J, Kanaar R. Dynamics of DNA double-strand breaks revealed by clustering of damaged chromosome domains. Science. 2004;303:92–95. - PubMed
    1. Barreto V, Reina-San-Martin B, Ramiro AR, McBride KM, Nussenzweig MC. C-terminal deletion of AID uncouples class switch recombination from somatic hypermutation and gene conversion. Mol Cell. 2003;12:501–508. - PubMed
    1. Bekker-Jensen S, Lukas C, Melander F, Bartek J, Lukas J. Dynamic assembly and sustained retention of 53BP1 at the sites of DNA damage are controlled by Mdc1/NFBD1. J Cell Biol. 2005;170:201–211. - PMC - PubMed
    1. Blanton J, Gaszner M, Schedl P. Protein:protein interactions and the pairing of boundary elements in vivo. Genes Dev. 2003;17:664–675. - PMC - PubMed
    1. Carter D, Chakalova L, Osborne CS, Dai YF, Fraser P. Long-range chromatin regulatory interactions in vivo. Nat Genet. 2002;32:623–626. - PubMed

Publication types

MeSH terms

Substances