. 2008 Feb 15;94(4):1428-36.
doi: 10.1529/biophysj.107.117473. Epub 2007 Nov 2.

Packaging of a polymer by a viral capsid: the interplay between polymer length and capsid size

Affiliations

Packaging of a polymer by a viral capsid: the interplay between polymer length and capsid size

Yufang Hu et al. Biophys J. .

Abstract

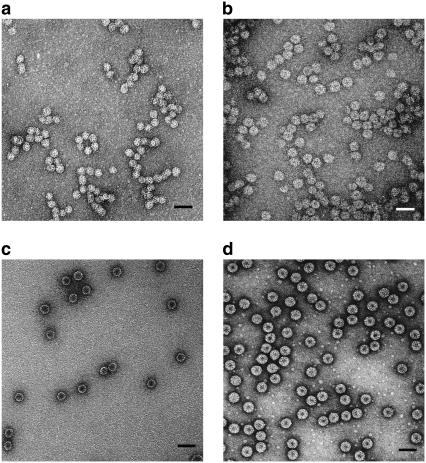
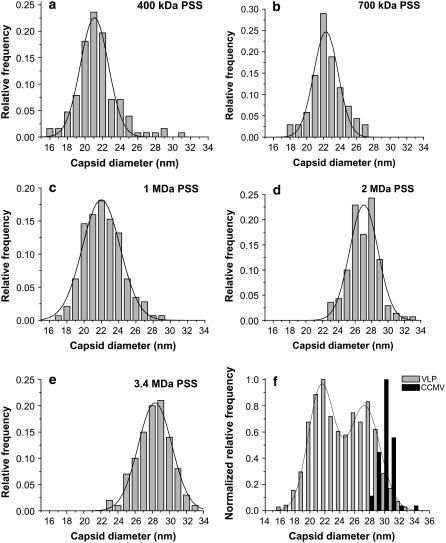
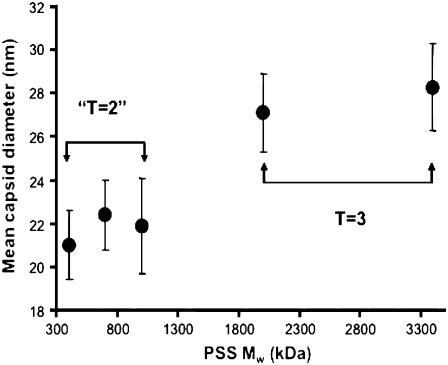
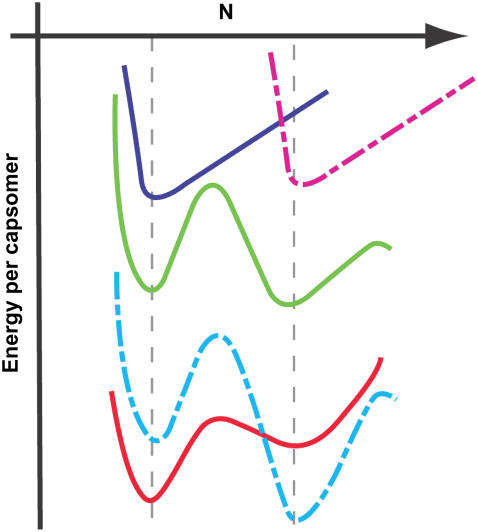
We report a study of the in vitro self-assembly of virus-like particles formed by the capsid protein of cowpea chlorotic mottle virus and the anionic polymer poly(styrene sulfonate) (PSS) for five molecular masses ranging from 400 kDa to 3.4 MDa. The goal is to explore the effect on capsid size of the competition between the preferred curvature of the protein and the molecular mass of the packaged cargo. The capsid size distribution for each polymer was unimodal, but two distinct sizes were observed: 22 nm for the lower molecular masses, jumping to 27 nm at a molecular mass of 2 MDa. A model is provided for the formation of the virus-like particles that accounts for both the PSS and capsid protein self-interactions and the interactions between the protein and PSS. Our study suggests that the size of the encapsidated polymer cargo is the deciding factor for the selection of one distinct capsid size from several possible sizes with the same inherent symmetry.


Figures

FIGURE 1
FIGURE 1
TEM images of capsids formed in self-assembly reactions. Samples were stained with 2% uranyl acetate. (a) VLPs formed with 700-kDa PSS. The mean capsid size for VLPs is 22 nm. (b) VLPs formed with 3.4-MDa PSS. The mean capsid size is 27 nm. (c) Empty CCMV capsids formed by dialysis of CP in buffer with high salt and low pH. The dark core in the center indicates the penetration of stain into “void” (aqueous solution) space, which is notably absent in the interiors of VLPs filled with PSS. (d) wt CCMV capsids in virus suspension buffer. Scale bars are 50 nm.
FIGURE 2
FIGURE 2
Separation of the products of the 2-MDa PSS plus CP assembly reaction on a 10–40% sucrose gradient. Comigration of species absorbing strongly at both 270 and 290 nm was found for fractions 7–13. The absorbances peaked at fraction 10.
FIGURE 3
FIGURE 3
Normalized VLP capsid size distribution histograms for Reactions 1–5. For each reaction, one dominant capsid size was found: (a) VLP 400 kDa, (b) VLP 700 kDa, (c) VLP 1 MDa, (d) VLP 2 MDa, (e) VLP 3.4 MDa; and (f) a combined histogram of capsids from all five reactions. A fit of the histogram to two Gaussians indicates that the capsid sizes converge to two values: 22 nm and 27 nm. These values agree well with the sizes of T = 2 and T = 3 capsids formed by CCMV CPs.
FIGURE 4
FIGURE 4
Mean capsid size as a function of packaged PSS molecular mass. A jump in the capsid size was observed when the molecular mass increased from 1 to 2 MDa.
FIGURE 5
FIGURE 5
Schematic illustration of the VLP size selection mechanism by the PSS molecular mass. The green line represents the self-energy per capsomer in an empty capsid as a function of the number of capsomers per capsid. For convenience it is shown as a continuous curve, but in reality it has meaning only for integral values of N. The energy minima correspond to structures with specific T-number icosahedral symmetry whose formation is energetically favorable. The upper blue and dashed red curves represent the interaction energy per capsomer of a given molecular mass PSS as a function of capsid size for each of two chain lengths; for a given PSS molecule, the interaction energy goes through a minimum as the capsid size varies. The optimal size for the VLP is determined by superimpositions (see lower red and dashed blue curves) of the capsomer-capsomer and the chain-capsomer interaction energy curves.

References

    1. Baker, T. S., N. H. Olson, and S. D. Fuller. 1999. Adding the third dimension to virus life cycles: three-dimensional reconstruction of icosahedral viruses from cryo-electron micrographs. Microbiol. Mol. Biol. Rev. 63:862–922. - PMC - PubMed
    1. Crick, F. H. C., and J. D. Watson. 1956. Structure of small viruses. Nature. 177:473–475. - PubMed
    1. Johnson, J. E., and R. R. Rueckert. 1997. Packaging and release of the viral genome. In Structural Biology of Viruses. W. Chiu, R. M. Burnett, and R. L. Garcea, editors. Oxford University Press, New York. 269–287.
    1. Smith, D. E., S. J. Tans, S. B. Smith, S. Grimes, D. L. Anderson, and C. Bustamante. 2001. The bacteriophage phi 29 portal motor can package DNA against a large internal force. Nature. 413:748–752. - PubMed
    1. Evilevitch, A., L. Lavelle, C. M. Knobler, E. Raspaud, and W. M. Gelbart. 2003. Osmotic pressure inhibition of DNA ejection from phage. Proc. Natl. Acad. Sci. USA. 100:9292–9295. - PMC - PubMed

Publication types

LinkOut - more resources