. 2008 Feb 15;94(4):1521-32.
doi: 10.1529/biophysj.107.112862. Epub 2007 Nov 2.

Elastic membrane heterogeneity of living cells revealed by stiff nanoscale membrane domains

Affiliations

Elastic membrane heterogeneity of living cells revealed by stiff nanoscale membrane domains

Charles Roduit et al. Biophys J. .

Abstract

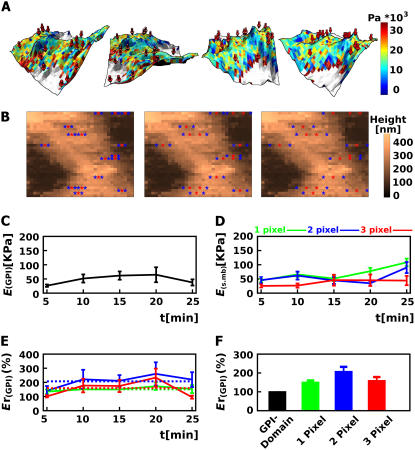
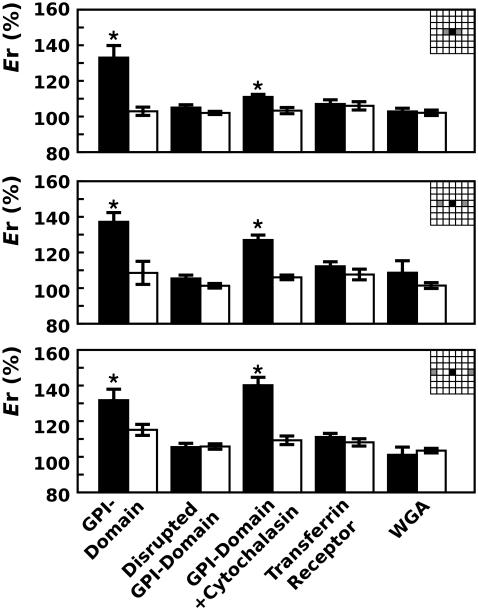
Many approaches have been developed to characterize the heterogeneity of membranes in living cells. In this study, the elastic properties of specific membrane domains in living cells are characterized by atomic force microscopy. Our data reveal the existence of heterogeneous nanometric scale domains with specific biophysical properties. We focused on glycosylphosphatidylinositol (GPI)-anchored proteins, which play an important role in membrane trafficking and cell signaling under both physiological and pathological conditions and which are known to partition preferentially into cholesterol-rich microdomains. We demonstrate that these GPI-anchored proteins reside within domains that are stiffer than the surrounding membrane. In contrast, membrane domains containing the transferrin receptor, which does not associate with cholesterol-rich regions, manifest no such feature. The heightened stiffness of GPI domains is consistent with existing data relating to the specific condensation of lipids and the slow diffusion rates of lipids and proteins therein. Our quantitative data may forge the way to unveiling the links that exist between membrane stiffness, molecular diffusion, and signaling activation.


Figures

FIGURE 1
FIGURE 1
Binding specificity and distribution of binding events between aerolysin-functionalized tip and GPI domains. (A) Experimental setup describing the tip coated either with the aerolysin wild-type (Aero WT), which binds GPI domains on the cell membrane, or with the mutant M41C, which does not bind to GPI domains. (B) Force-distance curves examples. Force-distance curves recorded neurites with binding-unbinding events highlighted in red. (C) Number of binding-unbinding events/force curves with aerolysin (Aero WT)-coated tip and with the non-GPI domain binding mutant Aero M41C-coated tip tested on hippocampal neurones. The number of force curves (FC) analyzed is indicated. Data are mean ± SE; asterisk, p < 0.03, two-tailed t-test.
FIGURE 2
FIGURE 2
Young's modulus (E) measurements on a single neurite and determination of the relative Young's modulus (Er) of GPI domains. (A) Rotation series of three-dimensional reconstructed images showing the stiffness (expressed in Pascal (Pa) according to a false color scale) mapped on the topography. Red arrows indicate the location of GPI domains (specific events). (B) Topography (A, top view, false colors) with red stars indicating GPI domains and blue stars indicating the immediately surrounding membranes at one, two, and three pixel distances apart. (C) Absolute stiffness evolution of the GPI domains shown as a function of time (E(GPI)). (D) Absolute stiffness values of the surrounding membrane (E(s.mb)) at one, two, and three pixels (green, blue, and red, respectively). (E) Relative stiffness of GPI domains (Er(GPI)) in percentage. For each binding-unbinding event, the Er(GPI) (red star in B) was calculated by dividing the E(GPI) by the mean of the E(s.mb) (blue stars in B) for the corresponding GPI domain at one, two, and three pixels apart (green, blue, and red, respectively). The mean of all the Er(GPI) was calculated and reported on the graph (12–30 values/time point). Data are mean ± SE. The means over the 25 min are indicated by dotted lines and reported on the histogram (F) together with the mean ± SE.
FIGURE 3
FIGURE 3
MeCD effect on the GPI domain relative stiffness. (A) Er(GPI) (GPI domain, inset: black squares) indicated in percentage and plotted as function of time before and after 2.5 mM MeCD injection. Er(GPI) are shown at one, two, and three pixels apart (inset: gray squares). The dotted line refers to the mean of Er(GPI) for the time periods (−30, −5) and (–45) min. (B) Er(Rand) of randomly chosen pixels containing no detected GPI domains plotted as in A. (C) Histograms of the means of the Er(GPI) (GPI domain) and of the Er(GPI) after MeCD treatment (disrupted GPI domain) corresponding to the Er(GPI) over the (−30, −5) and (–45) min periods shown in A, respectively, and of the Er(Rand) (random) shown in B. Five independent experiments were analyzed. Error bars indicate mean ± SE. (D) Mean of the total number of binding-unbinding events recorded with aerolysin-coated tips as a function of time. The means of the total number of binding events before and after MeCD injection are reported on the histogram. p > 0.03. (E) Mean of the number of binding events per positive pixel (i.e., in which binding-unbinding events occurred) as a function of time. The means of the number of binding-unbinding events per positive pixel before and after MeCD injection are reported on the histogram. Notice that for most pixels in which binding-unbinding events were detected only one specific event occurred. p > 0.03. Five independent experiments were analyzed. Error bars indicate mean ± SE.
FIGURE 4
FIGURE 4
Actin depolymerization effects on the GPI domain relative stiffness and absolute membrane stiffness. (A) Er(GPI) (GPI domain, inset: black squares) indicated in percentage and plotted as a function of time before and after cytochalasin B treatment (5 μM). Er(GPI) are shown at one, two, and three pixels apart (inset: gray squares). The dotted line refers to the mean of Er(GPI) for the time period (−30, −5) and (30, 90) min. (B) Er(RanI) of randomly chosen pixels containing no detected GPI domains plotted as in A. (C) Histograms of the means of the Er(GPI) before (GPI domain) and after cytochalasin B treatment (GPI domain + cytochalasin) corresponding to the Er(GPI) over (−30, −5) and (30–90) min, respectively, shown in A, and of the Er(Rand) shown in B (random). (D) Absolute Young's modulus (absolute stiffness) of neurites treated with cytochalasin B. The average of Young's modulus for the pixels covering the entire neurite in the scan frame was calculated at each time point and then plotted as a function of time. Between 4,636 and 5,086 force curves were analyzed per time point with a total of 34,492 and 63,245 force curves analyzed for the time periods before and after cytochalasin B treatment, respectively. Time points for injection of K5 and MeCD are indicated by arrows on the plot. The means of the absolute stiffness (in arbitrary unit) before and after MeCD injection are reported on the histogram. Five independent experiments were analyzed. Error bars indicate mean ± SE.
FIGURE 5
FIGURE 5
Comparison of the Er for GPI domains, transferrin-associated membrane, and WGA-associated membrane. Histograms indicate the mean of the Er calculated with aerolysin-coated tips for GPI domains, disrupted GPI domains (i.e., MeCD treated), and cytochalasin-treated GPI domains (data reported from Figs. 3 and 5). Means of the Er of the membrane recorded with anti-transferrin-coated tips and WGA-coated tips are also indicated. Means of the Er for the corresponding random controls are indicated in white filled boxes. The three histograms represent the results obtained when analyzing membranes located at one, two, and three pixels apart (see insets). Five independent experiments were analyzed. Error bars indicate mean ± SE.

References

    1. Kusumi, A., I. Koyama-Honda, and K. Suzuki. 2004. Molecular dynamics and interactions for creation of stimulation-induced stabilized rafts from small unstable steady-state rafts. Traffic. 5:213–230. - PubMed
    1. Lagerholm, B. C., G. E. Weinreb, K. Jacobson, and N. L. Thompson. 2005. Detecting microdomains in intact cell membranes. Annu. Rev. Phys. Chem. 56:309–336. - PubMed
    1. Milhiet, P., M. Giocondi, and G. C. Le. 2003. AFM imaging of lipid domains in model membranes. ScientificWorldJournal. 3:59–74. - PMC - PubMed
    1. Weisenhorn, A. L., M. Khorsandi, S. Kasas, V. Gotzos, and H.-J. Butt. 1993. Deformation and height anomaly of soft surfaces studied with an AFM. Nanotechnology. 4:106–113.
    1. Munro, S. 2003. Lipid rafts: elusive or illusive? Cell. 115:377–388. - PubMed

Publication types

LinkOut - more resources