. 2008 Jan 15;94(2):L14-6.
doi: 10.1529/biophysj.107.120154. Epub 2007 Nov 2.

The phasor approach to fluorescence lifetime imaging analysis

The phasor approach to fluorescence lifetime imaging analysis

Michelle A Digman et al. Biophys J. .

Abstract

Changing the data representation from the classical time delay histogram to the phasor representation provides a global view of the fluorescence decay at each pixel of an image. In the phasor representation we can easily recognize the presence of different molecular species in a pixel or the occurrence of fluorescence resonance energy transfer. The analysis of the fluorescence lifetime imaging microscopy (FLIM) data in the phasor space is done observing clustering of pixels values in specific regions of the phasor plot rather than by fitting the fluorescence decay using exponentials. The analysis is instantaneous since is not based on calculations or nonlinear fitting. The phasor approach has the potential to simplify the way data are analyzed in FLIM, paving the way for the analysis of large data sets and, in general, making the FLIM technique accessible to the nonexpert in spectroscopy and data analysis.


Figures

FIGURE 1
FIGURE 1
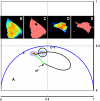
(A) Phasor plot of the FLIM images shown above. Transfected cells are: (B) CHO-K1 with YFP (306); (C) MEF with paxillin-CFP (442); (D) CHOK1 with EGFP (1537); and (E) CHO-K1 with the RAICHU-Rac1 construct (665). (F) Untransfected cells to measure phasor of cell autofluorescence and fibronectin (573). The numbers in parenthesis indicate counts of the brightest pixel. The red dashed line corresponds to one possible FRET trajectory passing through the clusters of phasors corresponding to cells in the field of view.
FIGURE 2
FIGURE 2
CHO-K1 cells transfected with paxillin EGFP in a three-dimensional collagen matrix. (A) Phasor plot of the two images. Region of the sample with a transfected cell (B) and with the collagen matrix (E). (C and F) Pixels in the image selected by the cursor at position 1 (EGFP) are highlighted in pink. (D and G) Pixels selected at position 2 (collagen). Position 3 represents weak background fluorescence. Pixels with multiple contributions lie along the line joining the EGFP and the collagen phasor (green line) or the background autofluorescence and the collagen phasor (black line). The cursor is used interactively to select a given cluster of phasors along the lines. The computer displays the relative contribution of the two species for each position of the cursor along the line.
FIGURE 3
FIGURE 3
MEF cells expressing cerulean and cerulean-venus constructs. (A) Phasor plot showing the clustering of phasors of cell B (c only) and (D) c-v construct. The curved trajectory corresponds to FRET efficiency (0–100%,) and for a percentage of background and donor unquenched. The green line joins the phasor of the cerulean and the autofluorescence phasor, independently determined. The FRET efficiency at the cursor position is 0.208. The counts in the brightest pixels were 457 and 192 for the c-v and c-only cell, respectively. The fraction of background was 9.5% and the fraction of unquenched donors was 0.9%. Image C shows pixels selected at the position of the c-only cell and image E when the position of the cursor is as shown in A.

References

    1. Wouters, F. S., P. J. Verveer, and P. I. Bastiaens. 2001. Imaging biochemistry inside cells. Trends Cell Biol. 11:203–211. - PubMed
    1. Peter, M., and S. M. Ameer-Beg. 2004. Imaging molecular interactions by multiphoton FLIM. Biol. Cell. 96:231–236. - PubMed
    1. Peyker, A., O. Rocks, and P. I. Bastiaens. 2005. Imaging activation of two Ras isoforms simultaneously in a single cell. ChemBioChem. 6:78–85. - PubMed
    1. Peter, M., S. M. Ameer-Beg, M. K. Hughes, M. D. Keppler, S. Prag, M. Marsh, B. Vojnovic, and T. Ng. 2005. Multiphoton-FLIM quantification of the EGFP-mRFP1 FRET pair for localization of membrane receptor-kinase interactions. Biophys. J. 88:1224–1237. - PMC - PubMed
    1. Becker, W., A. Bergmann, M. A. Hink, K. Konig, K. Benndorf, and C. Biskup. 2004. Fluorescence lifetime imaging by time-correlated single-photon counting. Microsc. Res. Tech. 63:58–66. - PubMed

Publication types

Substances