. 2008 Feb 15;94(4):1276-94.
doi: 10.1529/biophysj.107.111344. Epub 2007 Nov 2.

Role of N-terminal domain and accessory subunits in controlling deactivation-inactivation coupling of Kv4.2 channels

Affiliations

Role of N-terminal domain and accessory subunits in controlling deactivation-inactivation coupling of Kv4.2 channels

Jan Barghaan et al. Biophys J. .

Abstract

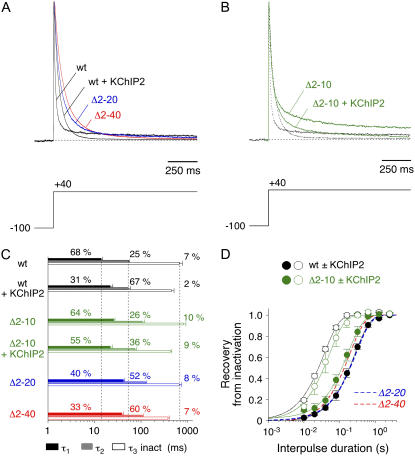
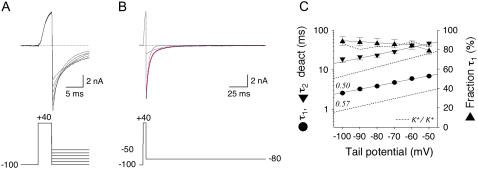
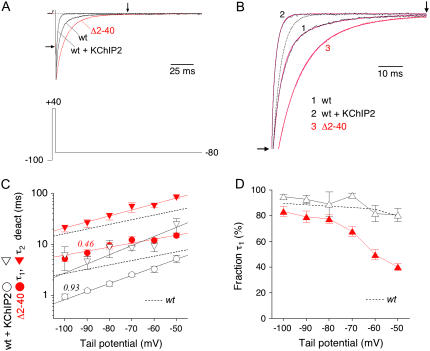
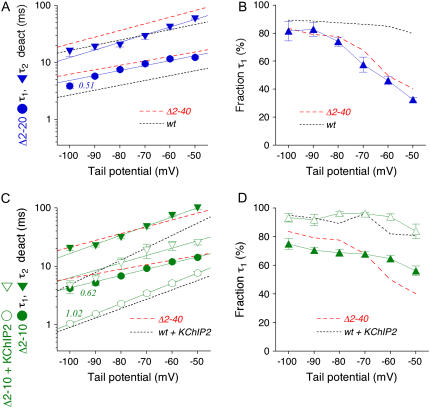
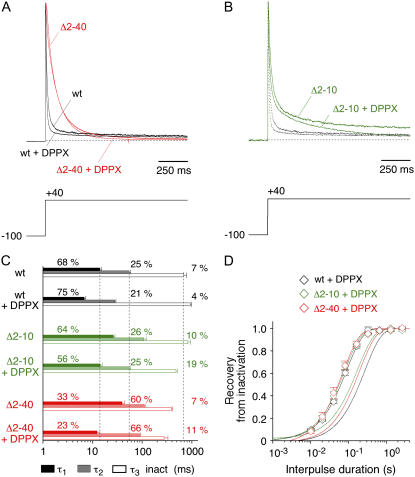
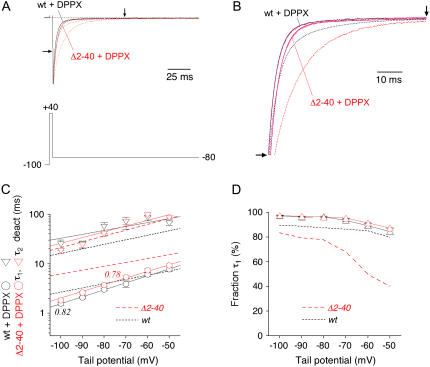
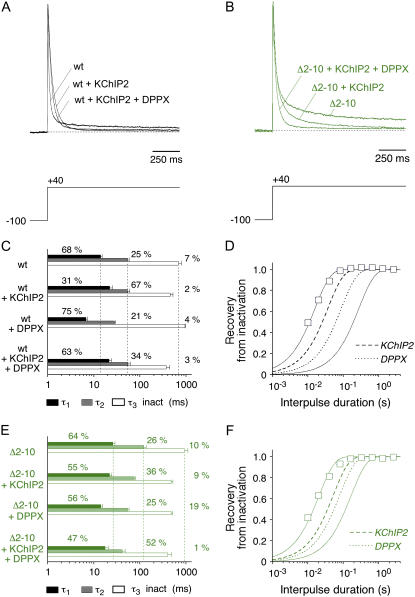
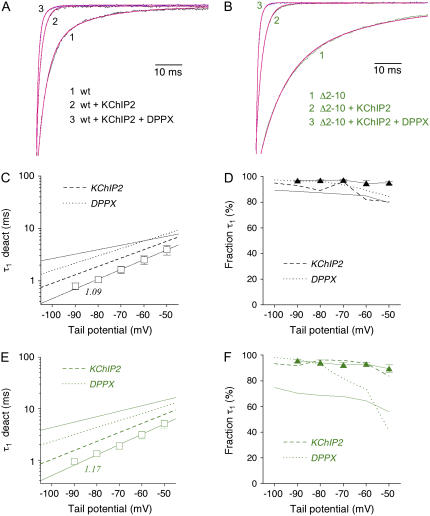
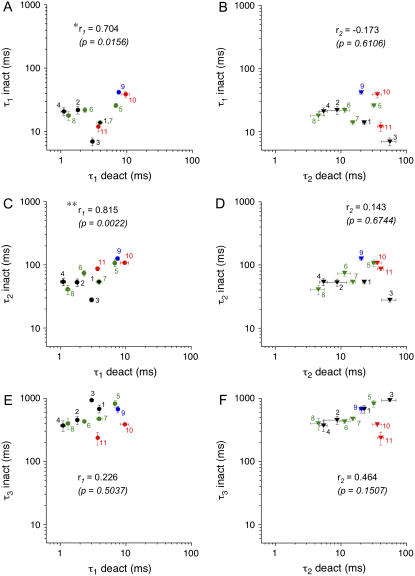
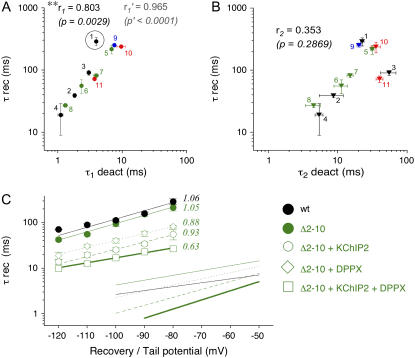
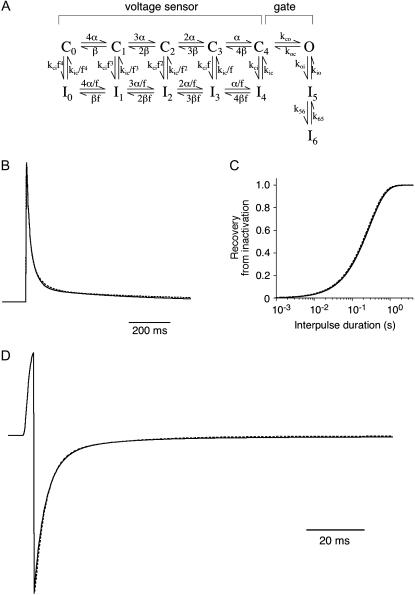
We examined the relationship between deactivation and inactivation in Kv4.2 channels. In particular, we were interested in the role of a Kv4.2 N-terminal domain and accessory subunits in controlling macroscopic gating kinetics and asked if the effects of N-terminal deletion and accessory subunit coexpression conform to a kinetic coupling of deactivation and inactivation. We expressed Kv4.2 wild-type channels and N-terminal deletion mutants in the absence and presence of Kv channel interacting proteins (KChIPs) and dipeptidyl aminopeptidase-like proteins (DPPs) in human embryonic kidney 293 cells. Kv4.2-mediated A-type currents at positive and deactivation tail currents at negative membrane potentials were recorded under whole-cell voltage-clamp and analyzed by multi-exponential fitting. The observed changes in Kv4.2 macroscopic inactivation kinetics caused by N-terminal deletion, accessory subunit coexpression, or a combination of the two maneuvers were compared with respective changes in deactivation kinetics. Extensive correlation analyses indicated that modulatory effects on deactivation closely parallel respective effects on inactivation, including both onset and recovery kinetics. Searching for the structural determinants, which control deactivation and inactivation, we found that in a Kv4.2 Delta 2-10 N-terminal deletion mutant both the initial rapid phase of macroscopic inactivation and tail current deactivation were slowed. On the other hand, the intermediate and slow phase of A-type current decay, recovery from inactivation, and tail current decay kinetics were accelerated in Kv4.2 Delta 2-10 by KChIP2 and DPPX. Thus, a Kv4.2 N-terminal domain, which may control both inactivation and deactivation, is not necessary for active modulation of current kinetics by accessory subunits. Our results further suggest distinct mechanisms for Kv4.2 gating modulation by KChIPs and DPPs.


Figures

FIGURE 1
FIGURE 1
Effects of N-terminal truncation and KChIP2 coexpression on macroscopic Kv4.2 inactivation. (A) Normalized representative A-type currents mediated by Kv4.2 wild-type (wt) in the absence and presence of KChIP2 (black traces) and by the N-terminal deletion mutants Kv4.2Δ2–20 (Δ2–20; blue trace) and Kv4.2Δ2–40 (Δ2–40; red trace) in the absence of KChIP2. Note the typical crossover of wild-type current traces in the absence and presence of KChIP2. (B) Currents mediated by Kv4.2Δ2–10 (Δ2–10) in the absence and presence of KChIP2 (green traces) in comparison to wild-type (traces from A indicated as dotted lines). Voltage protocols for current activation are shown below the traces. Only half of the length of a 2.5 s test pulse to +40 mV is shown, and horizontal dotted lines represent zero current. (C) Results obtained by fitting the sum of three exponentials to the A-type current decay. Time constants of inactivation are represented by horizontal bars, and respective relative amplitudes of the total decay (in %) are indicated. Vertical dotted lines represent mean values for wild-type time constants in the absence of KChIP2. (D) Recovery from inactivation was studied at −80 mV. Relative peak amplitudes, obtained with different interpulse durations, are shown for wild-type (black) and Kv4.2Δ2–10 (green) in the absence (solid symbols) and presence (open symbols) of KChIP2. Fitting curves represent single-exponential functions, broken lines without symbols respective curves for Kv4.2Δ2–20 (blue) and Kv4.2Δ2–40 (red) in the absence of KChIP2. Note logarithmic x-scaling in C and D.
FIGURE 2
FIGURE 2
Kinetic analysis of Kv4.2 channel-mediated tail current deactivation. Deactivation kinetics of Kv4.2 wild-type channels studied in symmetrical Rb+. (A) Tail currents elicited at membrane potentials between −100 and −50 mV after brief activation. Weaker hyperpolarization resulted in smaller tail currents with slower decay kinetics. (B) Tail current recording at −80 mV from the same cell as in A on a different timescale and at full length. The fitting curve in magenta represents a double-exponential function, and dotted curves of the respective individual components describe the fast and slow deactivation time constant. Voltage protocols for current activation and deactivation are indicated below the traces, and horizontal dotted lines represent zero current. (C) Summary of tail current analysis for Kv4.2 wild-type: Mean values obtained for the fast (τ1 deact, circles) and slow (τ2 deact, inverted triangles) deactivation time constant are plotted on a log scale (left y axis) against the respective tail potential. Straight lines represent exponential functions describing the voltage dependence of deactivation kinetics; apparent charge qapp for τ1 deact is indicated. Relative amplitudes describing the fraction of the total tail current decay accounted for by τ1 deact (right y axis) are illustrated as upright triangles. Dotted lines without symbols represent respective data obtained in symmetrical K+.
FIGURE 3
FIGURE 3
Effects of N-terminal deletion and KChIP2 coexpression on Kv4.2 deactivation kinetics. (A) Normalized tail current recordings at −80 mV obtained from three different cells expressing Kv4.2 wild-type (wt) in the absence or presence of KChIP2, or the N-terminal deletion mutants Kv4.2Δ2–40 (Δ2–40; red trace). Horizontal dotted line represents zero current, and outward currents during brief activation are truncated. (B) Zoomed view of tail current decay kinetics corresponding to the recordings shown in A (see arrows in A and B). Outward and instantaneous inward current components not illustrated. Fitting curves in magenta represent double-exponential functions. Dotted curve represents the fast component of wild-type current decay kinetics (see also Fig. 2 B), which is slower than the decay kinetics obtained for wt + KChIP2. (C) Fast (τ1 deact; circles) and slow time constants of deactivation (τ2 deact; inverted triangles) obtained for Kv4.2 wild-type in the presence of KChIP2 (open symbols) and for Kv4.2Δ2–40 (solid red symbols) plotted against the tail potential. Lines represent exponential functions describing the voltage dependence of deactivation kinetics. Broken lines without symbols represent wild-type data in the absence of KChIP2. Note that KChIP2 coexpression accelerates, whereas the N-terminal deletion slows tail current decay kinetics. Unlike N-terminal deletion, KChIP2 coexpression influences the voltage dependence of deactivation time constants (apparent charges qapp for τ1 deact are indicated). (D) Fraction of the total tail current decay accounted for by τ1 deact plotted against the tail potential. Broken line without symbols represents wild-type data in the absence of KChIP2. Note that in contrast to wt + KChIP2 (black) the relative amplitudes of τ1 obtained for Kv4.2Δ2–40 (red) show a decrease at less negative tail potentials.
FIGURE 4
FIGURE 4
Tail current kinetics of Kv4.2 N-terminal deletion mutants in the absence and presence of KChIP2. Kinetic analysis of tail current kinetics including their voltage dependence was performed for Kv4.2Δ2–20 (blue symbols; deactivation time constants in A and relative amplitudes of τ1 deact in (B) and for Kv4.2Δ2–10 (green symbols; deactivation time constants in C and relative amplitudes of τ1 deact in D). (A and B) Red and black broken lines without symbols represent data obtained for Kv4.2Δ2–40 and wild-type, respectively. Note that deleting 19 or 39 N-terminal amino acids results in similar effects on Kv4.2 deactivation kinetics. (C and D) Red and black broken lines without symbols represent data obtained for Kv4.2Δ2–40 and for wild-type + KChIP2, respectively. Note that deleting only nine N-terminal amino acids (green solid symbols) is sufficient to induce slowed deactivation kinetics. However, coexpressing Kv4.2Δ2–10 with KChIP2 induces deactivation kinetics indistinguishable from the ones obtained for wild-type + KChIP2, including a steeper voltage dependence of τ1 deact (see apparent charges qapp).
FIGURE 5
FIGURE 5
Effects of DPPX coexpression on macroscopic inactivation kinetics of Kv4.2 wild-type and N-terminal deletion mutants. (A) Normalized A-type currents mediated by Kv4.2 wild-type (black traces) and the N-terminal deletion mutant Kv4.2Δ2–40 (red traces) in the absence and presence of DPPX. (B) Currents mediated by Kv4.2Δ2–10 in the absence and presence of DPPX (green traces) in comparison to respective wild-type traces (black dotted). (C) Results obtained by fitting the sum of three exponentials to the A-type current decay. Vertical dotted lines represent mean values for wild-type time constants in the absence of DPPX. (D) Recovery from inactivation was studied at −80 mV for Kv4.2 wt (black open symbols), Kv4.2Δ2–10 (green open symbols), and Kv4.2Δ2–40 (red open symbols) in the presence of DPPX. Fitting curves represent single-exponential functions, curves without symbols respective data in the absence of DPPX. Note logarithmic x-scaling in C and D.
FIGURE 6
FIGURE 6
Effects of DPPX coexpression on deactivation kinetics of Kv4.2 wild-type and N-terminal deletion mutant. (A) Normalized tail current recordings at −80 mV obtained from two different cells expressing Kv4.2 wild-type (black) or the N-terminal deletion mutant Kv4.2Δ2–40 (red) in the presence of DPPX. Dotted curves represent respective data in the absence of DPPX. Note that DPPX exerts a much stronger effect on Kv4.2Δ2–40 deactivation. (B) Zoomed view of tail current decay kinetics corresponding to the recordings shown in A (see arrows in A and B). Fitting curves (magenta) represent double-exponential functions. (C) Fast (τ1 deact; circles) and slow time constants of deactivation (τ2 deact; inverted triangles) for Kv4.2 wild-type (open black symbols) and Kv4.2Δ2–40 (open red symbols) in the presence of DPPX are plotted against the tail potential. Apparent charges qapp from exponential functions describing the voltage dependence of deactivation are indicated for τ1 deact. Broken lines without symbols represent respective data in the absence of DPPX. (D) Fraction of the total tail current decay accounted for by τ1 deact plotted against the tail potential for Kv4.2 wild-type (open black triangles) and Kv4.2Δ2–40 (open red triangles) in the presence of DPPX. Broken lines without symbols represent respective data in the absence of DPPX.
FIGURE 7
FIGURE 7
Combined effects of KChIP2 and DPPX coexpression on macroscopic inactivation kinetics of Kv4.2 wild-type and N-terminal deletion mutant. (A) Normalized A-type currents mediated by Kv4.2 wild-type in the absence of accessory subunits, in the presence of KChIP2, and in the presence of both KChIP2 and DPPX. (B) Respective currents mediated by Kv4.2Δ2–10. (C and E) Results obtained by fitting the sum of three exponentials to the A-type current decay (C, Kv4.2 wild-type; E, Kv4.2Δ2–10). Vertical dotted lines represent mean values for respective time constants in the absence of accessory subunits. (D and F) Recovery from inactivation at −80 mV (D: Kv4.2 wild-type + KChIP2 + DPPX; F: Kv4.2Δ2–10 + KChIP2 + DPPX; open squares). Fitting curves represent single-exponential functions. Curves without symbols represent respective recovery data in the absence of accessory subunits (continuous lines) in the presence of only KChIP2 (dashed lines) and in the presence of only DPPX (dotted lines). Note logarithmic x-scaling in CF.
FIGURE 8
FIGURE 8
Combined effects of KChIP2 and DPPX coexpression on deactivation kinetics of Kv4.2 wild-type and N-terminal deletion mutant. (A and B) Zoomed view of normalized tail current recordings at −80 mV obtained from cells expressing Kv4.2 wild-type (A) or the N-terminal deletion mutant Kv4.2Δ2–10 (B) in the absence of accessory subunits, in the presence of only KChIP2, and in the presence of both KChIP2 and DPPX. Fitting curves (magenta) represent double-exponential functions. (C and E) Only fast time constants of deactivation (τ1 deact) for Kv4.2 wild-type and Kv4.2Δ2–10 in the presence of both KChIP2 and DPPX (open circles) are plotted against the tail potential. Straight lines represent exponential functions describing the voltage dependence of deactivation (apparent charges qapp for τ1 deact in the presence of both KChIP2 and DPPX are indicated). Lines without symbols represent data in the absence of accessory subunits (continuous lines), in the presence of only KChIP2 (dashed lines), and in the presence of only DPPX (dotted lines). (D and F) Fraction of the total tail current decay accounted for by τ1 deact (open triangles) plotted against the tail potential for Kv4.2 wild-type (D) and Kv4.2Δ2–10 (F) in the presence of both KChIP2 and DPPX. Lines without symbols represent data in the absence of accessory subunits (continuous lines) in the presence of only KChIP2 (dashed lines) and in the presence of only DPPX (dotted lines).
FIGURE 9
FIGURE 9
Correlation analysis of macroscopic inactivation and deactivation parameters. Mean values of inactivation time constants from Table 1 were plotted against respective mean values of the fast (τ1 deact; solid circles) and the slow (τ2 deact; inverted triangles) deactivation time constant from Table 2 on logarithmic scales. (A and B) τ1 inact; (C and D) τ2 inact; (E and F) τ3 inact. Groups of paired data points for individual channel constructs are represented by different colors (black, Kv4.2 wild-type; green, Kv4.2Δ2–10; blue, Kv4.2Δ2–20; red, Kv4.2Δ2–40), and each type of channel complex is indicated by a number; 1: Kv4.2 wild-type; 2: Kv4.2 wild-type + KChIP2; 3: Kv4.2 wild-type + DPPX; 4: Kv4.2 wild-type + KChIP2 + DPPX; 5: Kv4.2Δ2–10; 6: Kv4.2Δ2–10 + KChIP2; 7: Kv4.2Δ2–10 + DPPX; 8: Kv4.2Δ2–10 + KChIP2 + DPPX; 9: Kv4.2Δ2–20; 10: Kv4.2Δ2–40; 11: Kv4.2Δ2–40 + DPPX. Correlation coefficients r1 and r2 from Pearson's correlation analysis for τ1 deact and τ2 deact, respectively, are indicated together with respective p-values of significance: * significant correlation with p < 0.05; **significant correlation with p < 0.01.
FIGURE 10
FIGURE 10
Correlation analysis of recovery from inactivation and deactivation. Mean values of time constants of recovery from inactivation (τ rec) from Table 1 were plotted against respective mean values of the fast (τ1 deact; A) and slow deactivation time constant (τ2 deact; B) from Table 2 on logarithmic scales. Groups of paired data points for individual channel constructs are represented by different colors (black, Kv4.2 wild-type; green, Kv4.2Δ2–10; blue, Kv4.2Δ2–20; red, Kv4.2Δ2–40), and each type of channel complex is indicated by a number: 1, Kv4.2 wild-type; 2, Kv4.2 wild-type + KChIP2; 3, Kv4.2 wild-type + DPPX; 4, Kv4.2 wild-type + KChIP2 + DPPX; 5, Kv4.2Δ2–10; 6, Kv4.2Δ2–10 + KChIP2; 7, Kv4.2Δ2–10 + DPPX; 8, Kv4.2Δ2–10 + KChIP2 + DPPX; 9, Kv4.2Δ2–20; 10, Kv4.2Δ2–40; 11, Kv4.2Δ2–40 + DPPX. Correlation coefficients r1 and r2 from Pearson's correlation analysis for τ1 deact and τ2 deact, respectively, are indicated together with respective p-values of significance: *significant correlation with p < 0.05; **significant correlation with p < 0.01. Idealized correlation parameters r1′ and p′ obtained after exclusion of encircled data point (1 in A) are indicated in gray. (C) Voltage dependence of recovery from inactivation. Recovery time constants obtained by single-exponential fitting for Kv4.2 wild-type (black solid circles), Kv4.2Δ2–10 (green solid circles), Kv4.2Δ2–10 + KChIP2 (open circles), Kv4.2Δ2–10 + DPPX (open diamonds), and Kv4.2Δ2–10 + KChIP2 + DPPX (open squares) were plotted on a semilog scale against the recovery potential. Straight lines represent exponential functions describing the voltage dependence of recovery from inactivation. Apparent charges qapp are indicated. Included in the same plot are corresponding deactivation data: Lines without symbols represent the voltage dependences of the fast time constant of deactivation for the same Kv4.2 channel complexes (wt, continuous black line; Δ2–10, continuous green line; Δ2–10 + KChIP2, dashed green line; Δ2–10 + DPPX, dotted green line; Δ2–10 + KChIP2 + DPPX, bold green line; data from Figs. 2 C, 4 C, and 8 E).
FIGURE 11
FIGURE 11
Simulation of Kv4.2 channel gating with an allosteric model. (A) State diagram illustrating the transitions between closed (C), open (O), and inactivated (I) states, which define an allosteric model of Kv4.2 channel gating. (B–D) Experimentally determined key features of Kv4.2 macroscopic gating kinetics, including A-type current decay at +40 mV (B), recovery from inactivation at −80 mV (C), and tail current decay at −80 mV after activation at +40 mV (D) were reproduced by computer simulations using the wild-type rates in Table 3 (tail current simulation accounts for a fixed Rb+-factor of 0.37). Dotted lines, theoretical current and data templates representing mean values of macroscopic activation, inactivation, and deactivation parameters (see Materials and Methods).
FIGURE 12
FIGURE 12
Simulating effects of Kv4.2 channel gating modulation. By appropriate adjustment of rates based on the experimental results of this study (see Table 3), the effects of a nine amino acid N-terminal deletion (green), KChIP2 coexpression (dark gray), DPPX coexpression (light gray), and the coexpression of both KChIP2 and DPPX (magenta) on Kv4.2 channel gating were reproduced by computer simulations. (A) Effects on A-type current inactivation at +40 mV; (B) Effects on recovery from inactivation at −80 mV; (C) Effects on tail current decay kinetics at −80 mV taking into account a fixed Rb+-factor of 0.37 (see Table 3).

Similar articles

Cited by

References

    1. Baldwin, T. J., M. L. Tsaur, G. A. Lopez, Y. N. Jan, and L. Y. Jan. 1991. Characterization of a mammalian cDNA for an inactivating voltage-sensitive K+ channel. Neuron. 7:471–483. - PubMed
    1. Pak, M. D., K. Baker, M. Covarrubias, A. Butler, A. Ratcliffe, and L. Salkoff. 1991. mShal, a subfamily of A-type K+ channel cloned from mammalian brain. Proc. Natl. Acad. Sci. USA. 88:4386–4390. - PMC - PubMed
    1. Dixon, J. E., W. Shi, H. S. Wang, C. McDonald, H. Yu, R. S. Wymore, I. S. Cohen, and D. McKinnon. 1996. Role of the Kv4.3 K+ channel in ventricular muscle. A molecular correlate for the transient outward current. Circ. Res. 79:659–668. - PubMed
    1. Serodio, P., C. Kentros, and B. Rudy. 1994. Identification of molecular components of A-type channels activating at subthreshold potentials. J. Neurophysiol. 72:1516–1529. - PubMed
    1. Sheng, M., Y. J. Liao, Y. N. Jan, and L. Y. Jan. 1993. Presynaptic A-current based on heteromultimeric K+ channels detected in vivo. Nature. 365:72–75. - PubMed

Publication types

LinkOut - more resources