. 2007 Dec;3(12):779-84.
doi: 10.1038/nchembio.2007.49. Epub 2007 Nov 4.

Surveying polypeptide and protein domain conformation and association with FlAsH and ReAsH

Affiliations

Surveying polypeptide and protein domain conformation and association with FlAsH and ReAsH

Nathan W Luedtke et al. Nat Chem Biol. 2007 Dec.

Abstract

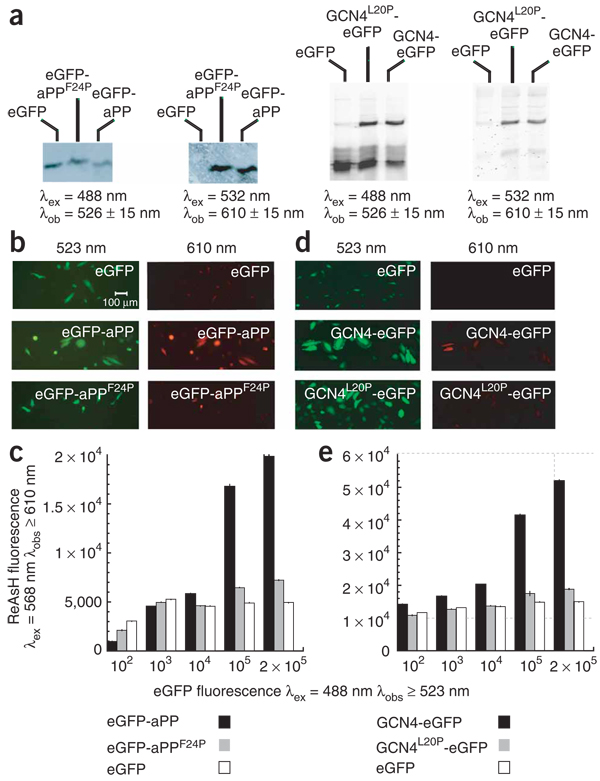
Recombinant polypeptides and protein domains containing two cysteine pairs located distal in primary sequence but proximal in the native folded or assembled state are labeled selectively in vitro and in mammalian cells using the profluorescent biarsenical reagents FlAsH-EDT2 and ReAsH-EDT2. This strategy, termed bipartite tetracysteine display, enables the detection of protein-protein interactions and alternative protein conformations in live cells. As proof of principle, we show that the equilibrium stability and fluorescence intensity of polypeptide-biarsenical complexes correlates with the thermodynamic stability of the protein fold or assembly. Destabilized protein variants form less stable and less bright biarsenical complexes, which allows discrimination of live cells expressing folded polypeptide and protein domains from those containing disruptive point mutations. Bipartite tetracysteine display may provide a means to detect early protein misfolding events associated with Alzheimer's disease, Parkinson's disease and cystic fibrosis; it may also enable high-throughput screening of compounds that stabilize discrete protein folds.


Figures

Figure 1
Figure 1
Intra- and intermolecular bipartite tetracysteine display using FlAsH-EDT2 and ReAsH-EDT2. (a) Structures of FlAsH-EDT2 (1) and ReAsH-EDT2 (2). (b) Scheme illustrating intramolecular and intermolecular bipartite tetracysteine display. (c) Polypeptide and protein domains used in this work. For intramolecular bipartite tetracysteine display, the polypeptides aPP (ref. 20) and Zip4 (ref. 21) and variants thereof each carried the first five and last five residues (underlined with cysteine residues in orange) of the optimized dodecameric tetracysteine sequence FLNCCPGCCMEP (ref. 9) split between the N and C termini. For intermolecular bipartite tetracysteine display the bZip domains of GCN4 (ref. 22) and Jun (ref. 23) each carried a single CCGG (GCN4 and variants) or Cys-Cys (Jun and variants) at the N or C terminus, respectively. An optimized dodecameric tetracysteine sequence and a variant obtained by replacing Pro-Gly with (Pro), which adopts a rodlike type II helix in solution, were used as positive and negative controls, respectively. Point mutations that disrupt folding, dimerization or both of these properties are shown in red. Apparent equilibrium dissociation constants (Kapp) of biarsenical complexes were measured in TTEE buffer containing 100 mM Tris-HCl (pH 7.8), 3.5 mM tricarboxyethylphosphine (TCEP), 1 mM EDT and 1 mM EDTA. PDB coordinates used to generate images of aPP, Zip4, GCN4 and Jun can be found using the following PDB ID numbers, respectively: 1PPT, 1LE3, 2ZTA and 1 JUN.
Figure 2
Figure 2
Equilibrium binding of FlAsH and ReAsH to polypeptides or protein domains containing a bipartite tetracysteine motif. (a, b) Each plot shows the emission intensity of FlAsH (a) or ReAsH (b) solutions on addition of the indicated polypeptide or protein domain. Binding reactions were performed using 25 nM FlAsH or ReAsH in 100 mM Tris-HCl (pH 7.8) containing 3.5 mM TCEP, 1 mM EDT and 1 mM EDTA. Emission intensities were monitored at 530 ± 12.5 nm (FlAsH) or 630 ± 17.5 nm (ReAsH). Each point represents the average of three or more independent titrations ± the s.d. All binding reactions were monitored as a function of time to determine when equilibrium had been reached. These experiments indicated that all binding reactions, except that between FlAsH and aPPF24P, reached equilibrium within 30–90 min.
Figure 3
Figure 3
Effect of FlAsH binding on the secondary structures of wild-type and variant polypeptides and protein domains. (a) aPP, aPPF24P and aPPF24,Y31P. (b) Zip4 and Zip4W9,16A. (c) GCN4 and GCN4L20P. (d) Jun and JunL20P. CD spectra of unmodified polypeptides are shown as solid lines; spectra of FlAsH complexes are shown as dotted lines. CD spectra were acquired at 25 °C in 10 mM phosphate buffer (pH 7.0) at [protein] = 10 µM (aPP, Zip4) or 20 µM (GCN4, Jun) in the absence of competing dithiols. [Θ] represents mean residue molar ellipticity. See Supplementary Figure 1 for concentration-dependent CD spectra of GCN4, Jun, GCN4L20P, JunL20P, FlAsH–(GCN4)2 and FlAsH–(Jun)2.
Figure 4
Figure 4
Misfolded polypeptides and their assemblies bind FlAsH and ReAsH with diminished affinities. Each plot shows the emission intensity of 25 nM FlAsH or ReAsH solutions on addition of the indicated wild-type or variant polypeptide or protein domain. Black symbols illustrate data for the negative control sequence in Figure 1. Binding reactions were performed as described in Figure 2. In the case of the β-hairpin Zip4, the fluorescence intensity of the misfolded variant Zip4W9,16A bound to FlAsH or ReAsH exceeded that of the wild type, presumably because of the two-fold lower tryptophan content of the variant. Error bars show s.d.
Figure 5
Figure 5
Differentiation of folded and misfolded proteins and assemblies in living cells with ReAsH-EDT2. (a) 12% PAGE of HeLa cell extracts containing eGFP, eGFP-aPPF24P and eGFP-aPP (left) or eGFP, GCN4L20P-eGFP and GCN4-eGFP (right) following treatment with ReAsH-EDT2 confirms that all fusion proteins are expressed and bind ReAsH. No other fluorescent bands were observed. Samples were loaded in 1% SDS sample buffer lacking DTT to prevent eGFP denaturation, which precludes quantitative analysis of eGFP or ReAsH emission. (b) Live HeLa cells expressing eGFP, eGFP-aPP and eGFP-aPPF24P. See Supplementary Figure 2 for close-up images of these cells. (c) Trypsinized cells expressing eGFP, eGFP-aPP and eGFP-aPPF24P were pelleted and analyzed by flow cytometry to monitor ReAsH fluorescence. The mean fluorescence intensities (arbitrary units) for ReAsH fluorescence were measured and plotted as a function of each log unit of eGFP fluorescence indicated. See Supplementary Figure 3 for the flow cytometry data used to generate these averages. Error bars shown indicate the standard error. See Supplementary Table 3 online for oligonucleotide sequences used for vector construction. We estimate that each eGFP fusion protein imaged in these experiments represents between 0.04 and 0.07% of total cellular protein. (d) Live HeLa cells expressing eGFP, GCN4-eGFP and GCN4L20P-eGFP. See Supplementary Figure 2 for close-up images of these cells. (e) Analysis as in c of cells expressing eGFP, GCN4-eGFP and GCN4L20P-eGFP.

References

    1. Shimomura O, Johnson FH, Saiga Y. Extraction, purification and properties of aequorin, a bioluminescent protein from the luminous hydromedusan, Aequorea. J. Cell. Comp. Physiol. 1962;59:223–239. - PubMed
    1. Prasher DC, Eckenrode VK, Ward WW, Prendergast FG, Cormier MJ. Primary structure of the Aequorea victoria green fluorescent protein. Gene. 1992;111:229–233. - PubMed
    1. Tsien RY. The green fluorescent protein. Annu. Rev. Biochem. 1998;67:509–544. - PubMed
    1. Giepmans BN, Adams SR, Ellisman MH, Tsien RY. The fluorescent toolbox for assessing protein location and function. Science. 2006;312:217–224. - PubMed
    1. Chudakov DM, Lukyanov S, Lukyanov KA. Fluorescent proteins as a toolkit for in vivo imaging. Trends Biotechnol. 2005;23:605–613. - PubMed

Publication types