Meta-Analysis
. 2007 Nov;3(11):e208.
doi: 10.1371/journal.pcbi.0030208. Epub 2007 Sep 11.

Meta-analysis of Drosophila circadian microarray studies identifies a novel set of rhythmically expressed genes

Affiliations
Meta-Analysis

Meta-analysis of Drosophila circadian microarray studies identifies a novel set of rhythmically expressed genes

Kevin P Keegan et al. PLoS Comput Biol. 2007 Nov.

Abstract

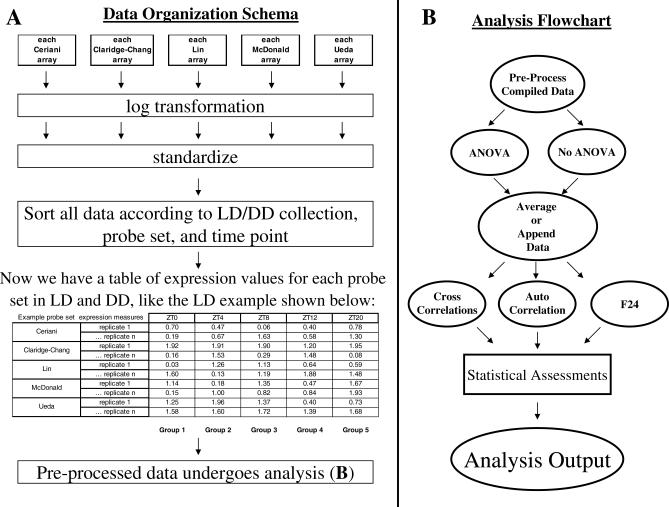
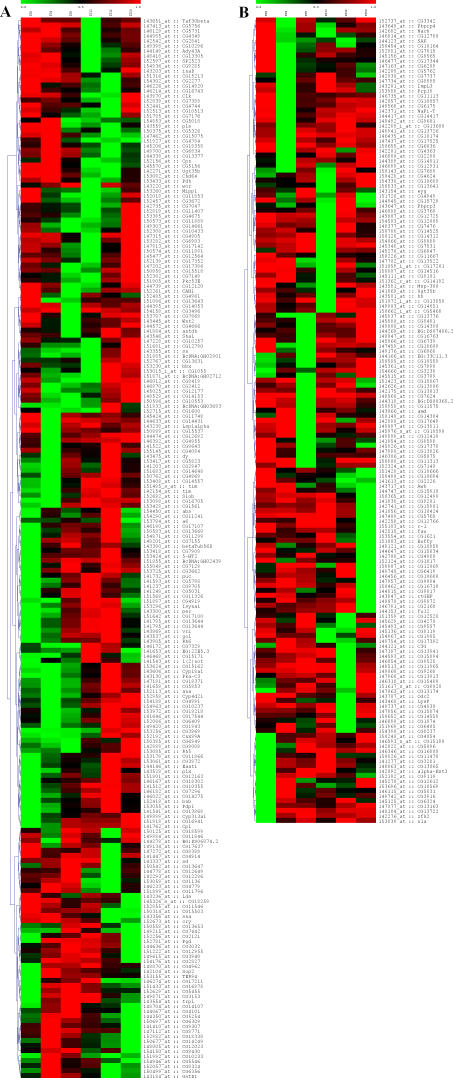
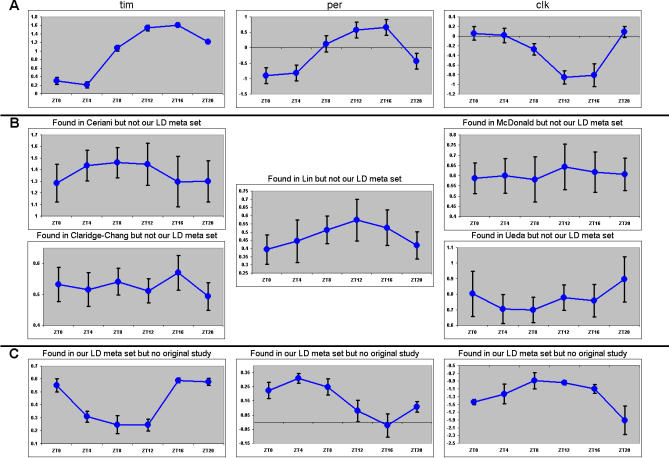
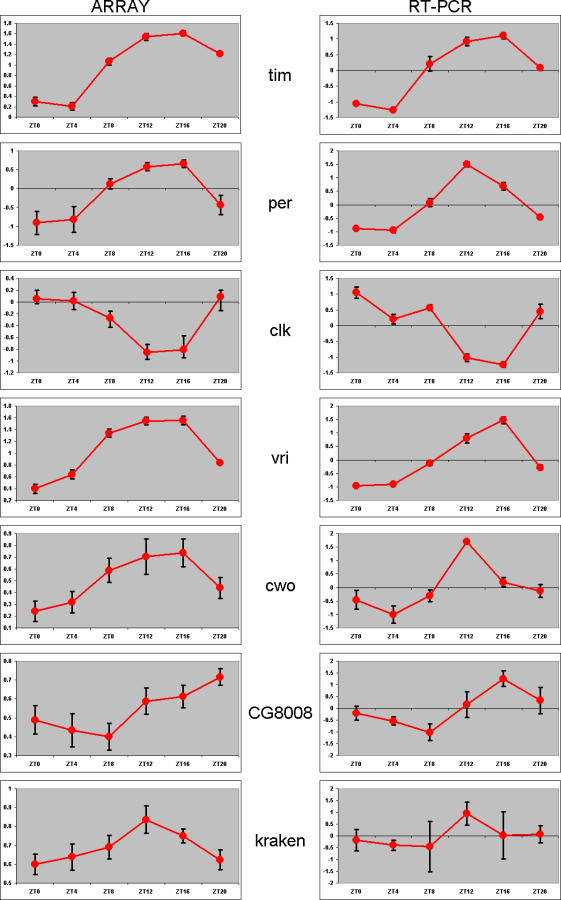
Five independent groups have reported microarray studies that identify dozens of rhythmically expressed genes in the fruit fly Drosophila melanogaster. Limited overlap among the lists of discovered genes makes it difficult to determine which, if any, exhibit truly rhythmic patterns of expression. We reanalyzed data from all five reports and found two sources for the observed discrepancies, the use of different expression pattern detection algorithms and underlying variation among the datasets. To improve upon the methods originally employed, we developed a new analysis that involves compilation of all existing data, application of identical transformation and standardization procedures followed by ANOVA-based statistical prescreening, and three separate classes of post hoc analysis: cross-correlation to various cycling waveforms, autocorrelation, and a previously described fast Fourier transform-based technique. Permutation-based statistical tests were used to derive significance measures for all post hoc tests. We find application of our method, most significantly the ANOVA prescreening procedure, significantly reduces the false discovery rate relative to that observed among the results of the original five reports while maintaining desirable statistical power. We identify a set of 81 cycling transcripts previously found in one or more of the original reports as well as a novel set of 133 transcripts not found in any of the original studies. We introduce a novel analysis method that compensates for variability observed among the original five Drosophila circadian array reports. Based on the statistical fidelity of our meta-analysis results, and the results of our initial validation experiments (quantitative RT-PCR), we predict many of our newly found genes to be bona fide cyclers, and suggest that they may lead to new insights into the pathways through which clock mechanisms regulate behavioral rhythms.


Conflict of interest statement

Competing interests. The authors have declared that no competing interests exist.

Figures

Figure 1
Figure 1. Analysis Outline
Graphic depiction of the analysis framework we applied to the compiled and individual datasets. (A) Data organization and preprocessing. Expression data from each individual array from each of the five studies were transformed into log2 coordinates and standardized such that the mean expression for each array was 0 and the standard deviation was 1. Data were then sorted according to probe set and LD/DD time of collection. This resulted in a table containing all expression measures for each of the 14,010 probe sets. (B) Flow diagram of all analyses that followed preprocessing. After preprocessing, time series data were optionally screened with ANOVA; all time series were appended and averaged to create appended and averaged datasets. These underwent three separate classes of analysis, (cross-correlation to a 24-h sin wave, an expression profile of per mRNA derived from So et al. [21], a profile derived from wild-type LD locomotor behavior, or a profile derived from wild-type DD locomotor activity, autocorrelation, and fast Fourier transform (F24) analysis as first described in Claridge-Chang et al. [1]).
Figure 2
Figure 2. Cluster Analysis of LD Data
Hierarchical clustering (LD data only: expression versus time) of genes that passed our ANOVA screening procedure is presented. The expression of all genes was normalized from 0 to 1. Red represents expression troughs; green, expression peaks. Genes are identified by symbol or CG number. (A) Characterized transcripts. Genes that passed the ANOVA prescreening procedure, and one or more of our post hoc tests. These genes are further described in Table 4. (B) Uncharacterized transcripts. Genes that passed our ANOVA screening procedure but none of our post hoc tests.
Figure 3
Figure 3. LD Expression Traces
Plots are LD expression versus time. Dots represent the averaged standardized expression for all arrays at the indicated timepoint. Error bars indicate the standard error of the mean. Transcripts are referenced by symbol or Affymetrix probe set. (A) Traces of known (class I) cycling genes, a random selection of genes detected by our analysis and one or more of the original reports. (B) Traces of genes missed by our analysis (class II). One example was randomly chosen from each of the five reports. Report author is indicated in parentheses. (C) Novel genes (class III). A random selection of genes detected by our analysis, but none of the original analyses. See Dataset S3, the interactive supplemental addendum to Figure 3: it allows the viewer to observe and print every profile in our averaged LD meta-dataset.
Figure 4
Figure 4. RT-PCR of Selected Genes
LD expression array data (left column), and the compiled quantitative RT-PCR results (right column) of six genes. Error bars indicate the standard error of the mean (eight to ten replicates per timepoint for the array data, three to five replicates per timepoint for the RT-PCR data). See Table 5 for results of our algorithmic analysis of these RT-PCR data. RT-PCR data for CG17100 (cwo) were adapted with permission from Lim et al. [26]; all other data are unique to this study.

References

    1. Claridge-Chang A, Wijnen H, Naef F, Boothroyd C, Rajewsky N, et al. Circadian regulation of gene expression systems in the Drosophila head. Neuron. 2001;32:657–671. - PubMed
    1. Wijnen H, Naef F, Young MW. Molecular and statistical tools for circadian transcript profiling. Methods Enzymol. 2005;393:341–365. - PubMed
    1. Wijnen H, Naef F, Boothroyd C, Claridge-Chang A, Young MW. Control of daily transcript oscillations in Drosophila by light and the circadian clock. PLoS Genet. 2006;2:e39. doi: 10.1371/journal.pgen.0020039. - DOI - PMC - PubMed
    1. Allada R. Circadian clocks: A tale of two feedback loops. Cell. 2003;112:284–286. - PubMed
    1. Allada R, Emery P, Takahashi JS, Rosbash M. Stopping time: The genetics of fly and mouse circadian clocks. Annu Rev Neurosci. 2001;24:1091–1119. - PubMed

Publication types

MeSH terms

LinkOut - more resources