. 2007 Nov;6(5):348-51.
doi: 10.1016/j.cmet.2007.10.005.

Metabolomics

Affiliations

Metabolomics

Jeffrey R Idle et al. Cell Metab. 2007 Nov.

Abstract

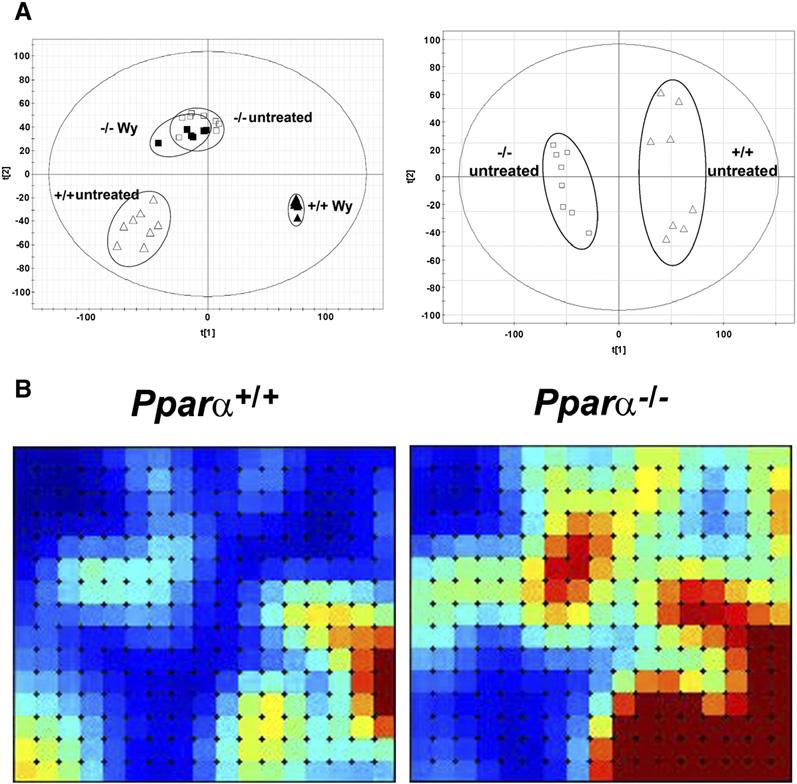
Metabolomics is the systematic identification and quantitation of all metabolites in a given organism or biological sample. The enhanced resolution provided by nuclear magnetic resonance (NMR) spectroscopy and mass spectrometry (MS), along with powerful chemometric software, allows the simultaneous determination and comparison of thousands of chemical entities, which has lead to an expansion of small molecule biochemistry studies in bacteria, plants, and mammals. Continued development of these analytical platforms will accelerate the widespread use of metabolomics and allow further integration of small molecules into systems biology. Here, recent studies using metabolomics in xenobiotic metabolism and genetically modified mice are highlighted.


Figures

Figure 1
Figure 1. PPARα Metabolomics
(A) Metabolomics analysis of ligand-treated and untreated wild-type (+/+) and Pparα null (−/−) mice by ultra-performance liquid chromatography/time-of-flight mass spectrometry. Left panel: principal components analysis (PCA) scores plot of principle component 1 versus principle component 2 for four groups of mice, wild-type and Pparα null mice both untreated and treated with Wy-14,643, a PPARα agonist ligand. Right panel: PCA scores plot of component 1 versus component 2 for two groups of mice, untreated wild-type and Pparα null mice. Note that the treated and untreated null mice cluster together. (B) Analyses and visualization of patterns in MS data matrices. Self-organizing maps showing a holistic view of the mouse urinary metabolome for groups of male C57BL/6 mice with Pparα+/+ and Pparα−/− genotypes. Maps were constructed using Gene Expression Dynamics Inspector (GEDI) software (Guo et al., 2006) and published data (Zhen et al., 2007). Each tile comprises a group of metabolites that covary across the whole data set, on average 12. Dark blue is the lowest intensity of metabolites; dark red is the highest intensity. The two urinary biomarkers for the Pparα+/+ genotype that we have reported (Zhen et al., 2007), 2,8-dihydroxyquinoline and xanthurenic acid, are both located in the bottom right tiles and are thus in the region that is considerably elevated by the presence of the Pparα gene. Figure 1B kindly provided by A. Patterson (Laboratory of Metabolism, Center for Cancer Research, NCI, NIH).

References

    1. Brindle JT, Antti H, Holmes E, Tranter G, Nicholson JK, Bethell HW, Clarke S, Schofield PM, McKilligin E, Mosedale DE, Grainger DJ. Nat. Med. 2002;8:1439–1444. - PubMed
    1. Chen C, Meng L, Ma X, Krausz KW, Pommier Y, Idle JR, Gonzalez FJ. J. Pharmacol. Exp. Ther. 2006;318:1330–1342. - PMC - PubMed
    1. Chen C, Ma X, Malfatti MA, Krausz KW, Kimura S, Felton JS, Idle JR, Gonzalez FJ. Chem. Res. Toxicol. 2007;20:531–542. - PMC - PubMed
    1. Clayton TA, Lindon JC, Cloarec O, Antti H, Charuel C, Hanton G, Provost JP, Le Net JL, Baker D, Walley RJ, et al. Nature. 2006;440:1073–1077. - PubMed
    1. Dixon RA, Gang DR, Charlton AJ, Fiehn O, Kuiper HA, Reynolds TL, Tjeerdema RS, Jeffery EH, German JB, Ridley WP, Seiber JN. J. Agric. Food Chem. 2006;54:8984–8994. - PubMed

LinkOut - more resources