Review
. 2007 Nov;17(4):469-84, viii-ix.
doi: 10.1016/j.nic.2007.07.005.

Mapping cognitive function

Affiliations
Review

Mapping cognitive function

Steven M Stufflebeam et al. Neuroimaging Clin N Am. 2007 Nov.

Abstract

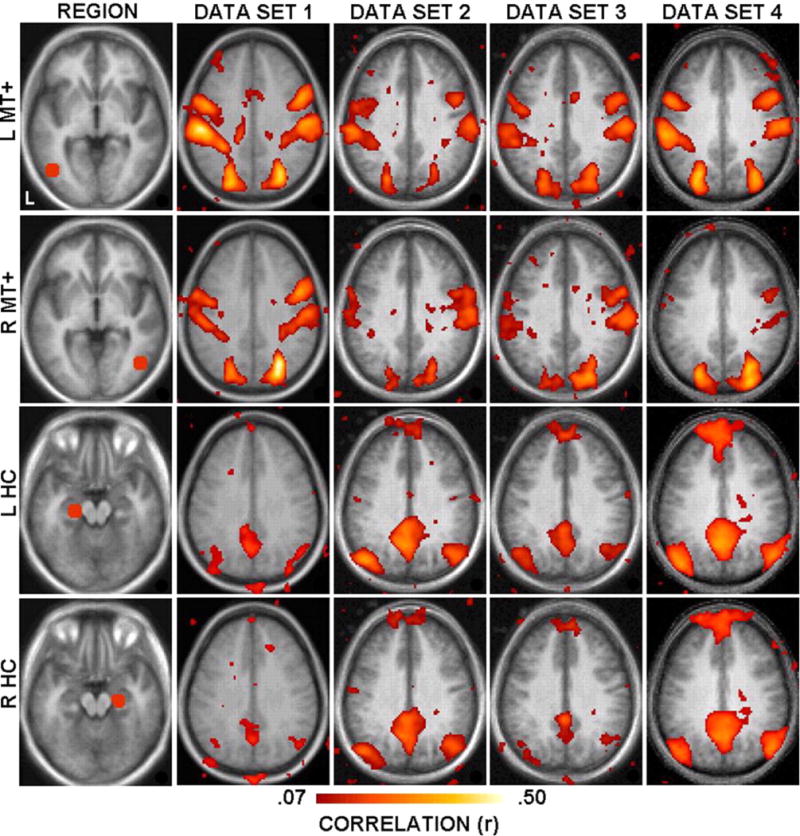
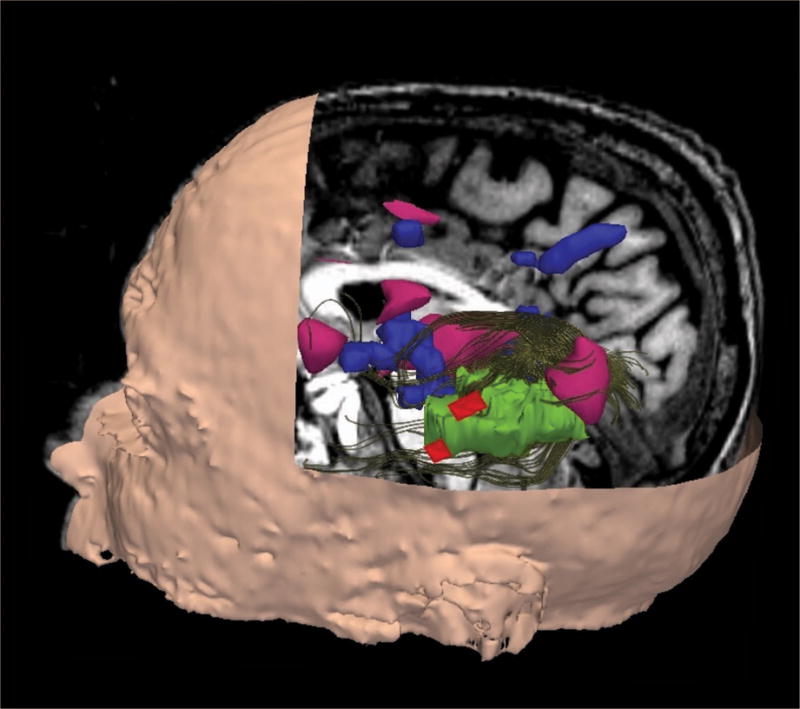
Cognitive functions are fundamental to being human. Although tremendous progress has been made in the science of cognition using neuroimaging, the clinical applications of neuroimaging are just beginning to be realized. This article focuses on selected technologies, analysis techniques, and applications that have, or will soon have, direct clinical impact. The authors discuss how cognition can be imaged using MR imaging, functional MR imaging, positron emission tomography, magnetoencephalography and electroencephalography, and MR imaging diffusion tensor imaging. A unifying theme of this article is the concept that a more complete understanding of cognition only comes through integration of multimodal structural and functional imaging technologies.


Figures

Figure 1
Figure 1. Auditory mismatch response and combining MEG with fMRI data
Upper panel shows both a three-dimensional (3-D) rendering of a brain computed from the subject's MRI with the corresponding inflated cortex patch around the auditory areas. Labeled areas include Heschl's gyrus (HG), planum temporale (PT), superior temporal gyrus (STG), superior temporal sulcus (STS), and middle temporal gyrus (MTG). The middle panel depicts the equivalent current dipole (ECD) method, which is traditionally used for MEG source estimation. On the left is a sagittal MRI with the ECD source estimate location with the black bar indicating the dipole direction. On the right, the dipole representing the peak in the magnetic mismatch response is registered onto an inflated cortex. Notice that in this case the dipole is near the anterior portion of Heschl's gyrus. Integration of the fMRI, MEG data, and the inflated cortex data are combined (lowest panel) to create a ‘movie’ or spatiotemporal map. The fMRI data superimposed on source echoplanar imaging (EPI) BOLD MRI images, which is then transformed onto the inflated cortex. This illustrates how the activity from MEG are transformed using the minimum norm estimate (MNE), onto an inflated cortical source. Next, the fMRI data and the MNE results are combined into a spatiotemporal movie (dSPM). Some activity of the mismatch response is seen at 93 ms, which peaks at approximately 103 ms, and is diminished by 113 ms.
Figure 2
Figure 2. ASSR in Schizophrenia
(A) Magnetic field strength (fT/cm) versus time (stimulus presented at time 0, lasting ∼ 500msec) in a single MEG channel over the temporal lobe. Note the appearance of middle latency evoked response (N100m) as well as the overriding sustained field. (B) Power spectral density in a temporal lobe gradiometer (maximal response for auditory stimuli) over the time interval 0-500ms. Note that in the control subjects, the 40Hz is the largest response (greater than both the 20Hz and 30Hz power peaks, often twice the magnitude). In this case, however, the 40Hz power is less than half the power in either the 20Hz or the 30Hz power, although the 20Hz response is maximal at a frequency somewhat less than 20Hz. (C) Time frequency representation (TFR) showing the spectral power as a function of time. Sustained neuromagnetic field from MEG gamma band response to periodic auditory clicks at 40Hz in a control subject. The color scale shows increased spectral power of the Morlet wavelet (blue to red for increasing power). (D) Source estimation localization using the same response to same auditory clicks from (A) [121], with the fMRI spatial information (not shown) using a Morlet wavelet-based minimum norm estimate (MNE) centered at 40Hz at time 230msec after beginning of click train. It is displayed on an inflated cortical surface of the same subject. The activity appears to involve middle and medial Heschl's gyrus, extending into the planum temporale. Note that the MEG power spectrum calculated with a FFT in (B) does not include any temporal information unlike the wavelet-transformed measures such as the TFR in (C) and the spectral spatiotemporal map (dSPM) in (D).
Figure 3
Figure 3. Cognition and white matter from diffusion MRI
The correlation coefficient (rs) between CRT and FA is displayed as map overlaid on the T1 template from a standard atlas. The small frames show axial slices through the optic radiation. The superior-inferior level of the axial slices is indicated by the yellow lines in the sagittal images. The sagittal images at top right are the Montreal Neurological Institute (MNI) individual T1 template (Left) and the group average FA map (Right). The correlation map shows the trajectory of the right visual pathway from lateral geniculate nucleus (LGN) through Meyer's loop (ML) to the optic radiation (OR), terminating at the junction between the optic radiation and the posterior forceps of the corpus callosum (OR-PF). [Used with permission by the author in Tuch DS, Salat DH, Wisco JJ, Zaleta AK, Hevelone ND, Rosas HD. Choice reaction time performance correlates with diffusion anisotropy in white matter pathways supporting visuospatial attention. Proc Natl Acad Sci U S A. Aug 23 2005;102(34):12212-12217].
Figure 4
Figure 4. Resting State Networks
Correlation maps are illustrated for the four seed regions. Left middle temporal (L MT+) and Right middle temporal (L MT+) are left and right regions defined around the MT+ complex; L HF and R HF are left and right regions defined within the hippocampal formation. Each image shows the mean voxel-wise correlation (a measure of functional connectivity) to the specific region displayed on the left. Four independent participant groups were analyzed. Only positive correlations are shown. Correlation maps are overlaid onto the average anatomic image for each group. Note the consistency of the difference between correlation with MT+ vs. HF seed regions and also the reproducibility of the topography across independent data sets. [Used with permission from author. Copyright belongs to Vincent JL, Snyder AZ, Fox MD, Shannon BJ, Andrews JR, Raichle ME, et al. Coherent spontaneous activity identifies a hippocampal-parietal memory network. J Neurophysiol. Dec 2006;96(6):3517-3531].
Figure 5
Figure 5. Connectivity Analysis of Visual Language using Magnetoencephalography
A. MEG Equivalent Current Dipole (ECD) location for a visually-presented word in the occipital lobe. B. ECD localization of temporal lobe dipole for same stimulus in (A). C. Current dipole time course of ECD in occipital lobe (solid line) and temporal lobe (dashed line). D. Time Frequency Representation of spectral power in the occipital lobe showing both upper alpha band activity (centered ∼10Hz) and beta band activity (20Hz). E. Intratrial coherence of activity in the occipital ECD. F. Granger causality demonstrating two periods of occipital (labeled V1) and the temporal ECD (STG), without any significant temporal to occipital influence.
Figure 6
Figure 6. Theta Oscillations in Memory
Theta Inflated cortex with MEG/EEG activity in the medial temporal lobe during a visually presented semantic memory task. Note that the activity represents the spatiotemporal map [121] of the theta-band activity (∼5Hz) which is know to modulate recall and encoding in the medial temporal lobe structures.
Figure 7
Figure 7. Presurgical Mapping of language
Multimodal approach using MEG, DTI and fMRI. Blue regions represent MEG language localizations. Red areas represent fMRI language activations. Brown tracts represent white matter tractography. Note regions where MEG and fMRI language overlap, as these co-localizations were used as seeding points for tractography generation. Where MEG and fMRI language overlap, these co-localizations were used as seeding points for tractography generation. Images provided by Dr. Alexandra Golby, M.D. and Dr. Ralph Suarez, Brigham and Women's Hospital, Boston, MA.

References

    1. Baird AA, Colvin MK, Vanhorn JD, Inati S, Gazzaniga MS. Functional connectivity: integrating behavioral, diffusion tensor imaging, and functional magnetic resonance imaging data sets. J Cogn Neurosci. 2005 Apr;17(4):687–693. - PubMed
    1. Cabeza R, Kingstone A. Handbook of functional neuroimaging of cognition. 2nd. Cambridge, Mass: MIT Press; 2006.
    1. Jaaskelainen IP, Ahveninen J, Bonmassar G, Dale AM, Ilmoniemi RJ, Levanen S, et al. Human posterior auditory cortex gates novel sounds to consciousness. Proc Natl Acad Sci U S A. 2004 Apr 27;101(17):6809–6814. - PMC - PubMed
    1. Jaaskelainen IP, Bonmassar G, Melcher J, Stufflebeam S, Hawley M, May P, et al. Cortical mechanisms of pre-attentive auditory “gating”. Paper presented at: Human Brain Mapping Conference; 2001; Brighton, U.K..
    1. Naatanen R, Gaillard AWK, Mantysalo S. Early selective-attention effect on evoked potential reinterpreted. Acta Psychologica. 1978;42:313–329. - PubMed

Publication types