. 2008 Jan;36(1):51-66.
doi: 10.1093/nar/gkm942. Epub 2007 Nov 5.

Nuclear receptor interaction protein, a coactivator of androgen receptors (AR), is regulated by AR and Sp1 to feed forward and activate its own gene expression through AR protein stability

Affiliations

Nuclear receptor interaction protein, a coactivator of androgen receptors (AR), is regulated by AR and Sp1 to feed forward and activate its own gene expression through AR protein stability

Pei-Hong Chen et al. Nucleic Acids Res. 2008 Jan.

Abstract

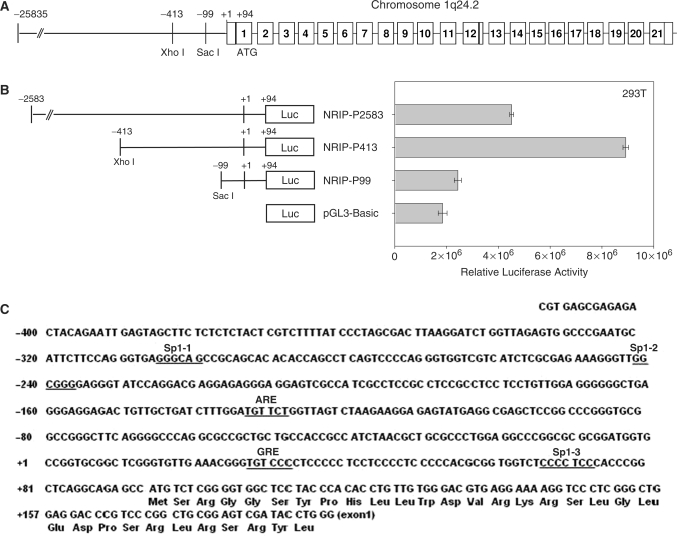
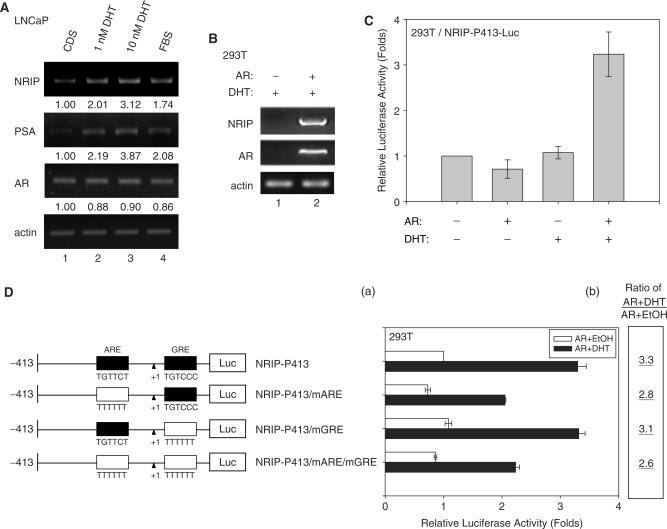
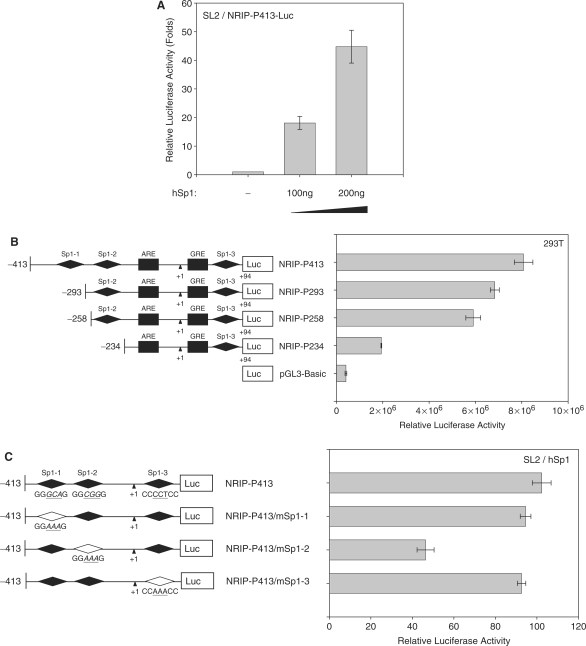
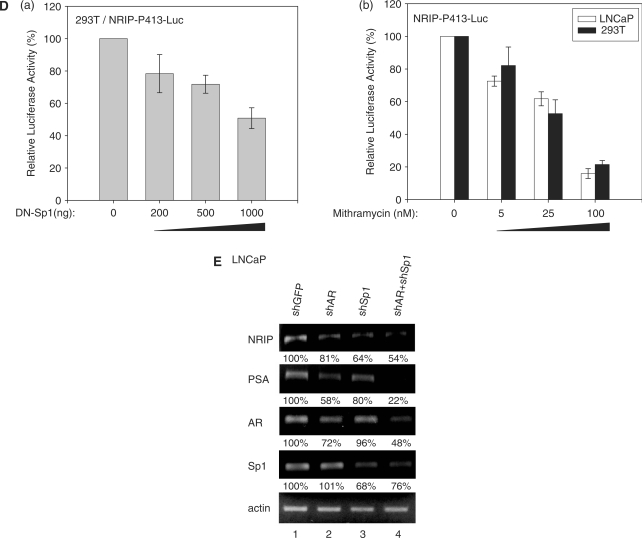
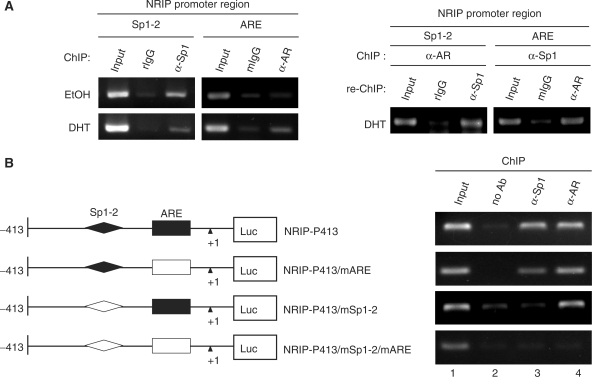
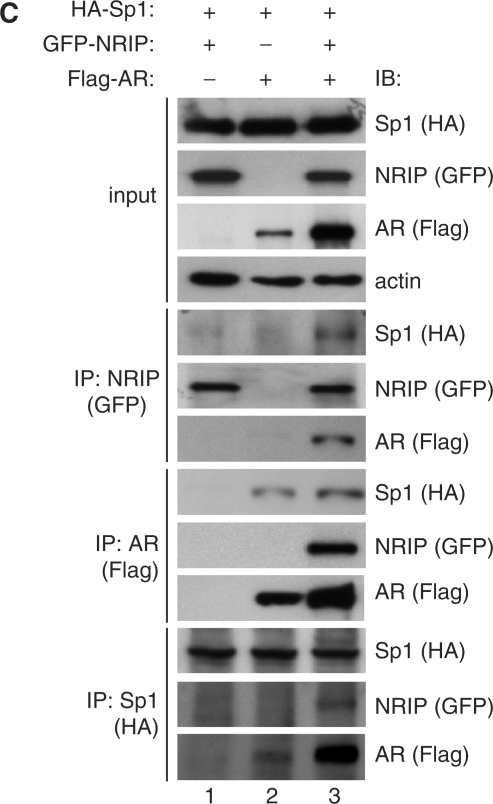
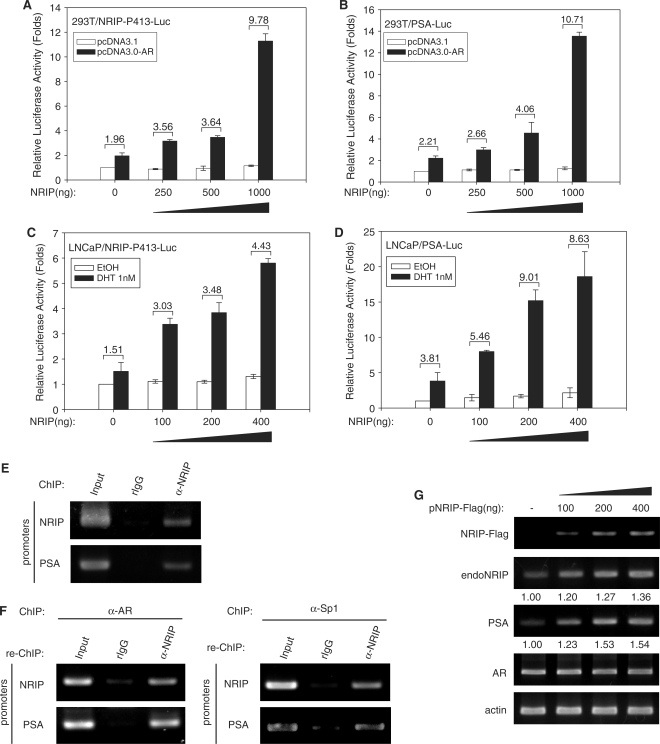
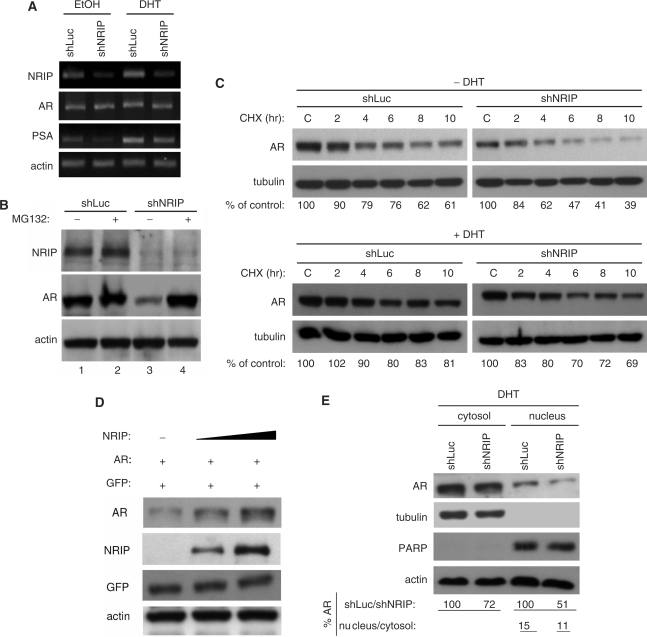
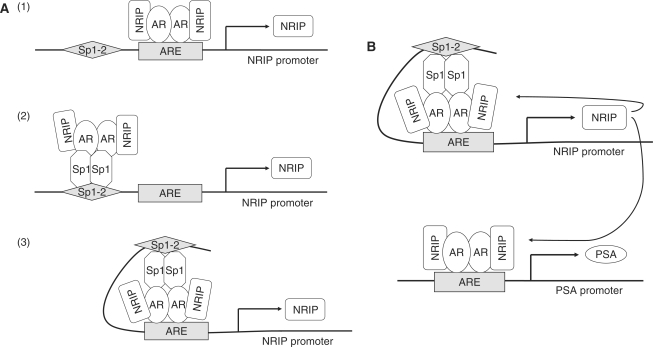
Previously, we found a novel gene, nuclear receptor interaction protein (NRIP), a transcription cofactor that can enhance an AR-driven PSA promoter activity in a ligand-dependent manner in prostate cancer cells. Here, we investigated NRIP regulation. We cloned a 413-bp fragment from the transcription initiation site of the NRIP gene that had strong promoter activity, was TATA-less and GC-rich, and, based on DNA sequences, contained one androgen response element (ARE) and three Sp1-binding sites (Sp1-1, Sp1-2, Sp1-3). Transient promoter luciferase assays, chromatin immunoprecipitation and small RNA interference analyses mapped ARE and Sp1-2-binding sites involved in NRIP promoter activation, implying that NRIP is a target gene for AR or Sp1. AR associates with the NRIP promoter through ARE and indirectly through Sp1-binding site via AR-Sp1 complex formation. Thus both ARE and Sp1-binding site within the NRIP promoter can respond to androgen induction. More intriguingly, NRIP plays a feed-forward role enhancing AR-driven NRIP promoter activity via NRIP forming a complex with AR to protect AR protein from proteasome degradation. This is the first demonstration that NRIP is a novel AR-target gene and that NRIP expression feeds forward and activates its own expression through AR protein stability.


Figures

Figure 1.
Figure 1.
Identification of the promoter region in the NRIP gene. (A) Genomic organization of the human NRIP gene on chromosome 1q24.2. The numbers in box refer to exon regions. (B) Identification of the promoter activity in the 5′-flanking region of the NRIP gene. The nucleotides between –2583 and +94 relative to the transcription start site of the NRIP gene were amplified by PCR and cloned into pGL3-Basic and then named NRIP-P2583. Series deletions of ∼ −413 to +94 and ∼ −99 to +94 regions were constructed by XhoI and SacI digestion and cloned into pGL3-Basic and named NRIP-P413 and NRIP-P99, respectively. 293T cells were transiently co-transfected into the indicated reporter promoter with pRL-CMV (as an internal control). The relative luciferase activity is expressed as the measured firefly luciferase activities (promoter activity), which were normalized by renila luciferase activity (pRL-CMV). The results are shown as mean ± SD from three independent experiments. (C) The putative transcription factor binding elements in the NRIP gene. The NRIP promoter sequences (–413 to +94) were analyzed by Transcription Element Search System (TESS, http://www.cbil.upenn.edu/cgi-bin/tess/tess). Three Sp1 and two hormone response elements, ARE and GRE, were underlined.
Figure 2.
Figure 2.
NRIP is a novel AR-targeted gene. (A) Androgen can induce NRIP and PSA gene expression as measured by RT-PCR in prostate cancer cells (LNCaP). LNCaP cells were grown in RPMI 1640 medium supplemented with 10% FBS or with charcoal/dextran-stripped serum (CDS) and treated with 1 and 10 nM DHT for 24 h. Total RNA was extracted and 5 µg of RNA was amplified by semi-quantitative RT-PCR using NRIP, PSA, AR and β-actin primers. One representative data set from three independent experiments is shown. The expression levels of NRIP, PSA and AR RNA quantified by UVP imaging system were normalized to β-actin, and then set at 1.00 for CDS treatment. (B) AR with androgen can stimulate NRIP gene expression in 293T cells. AR-negative 293T cells were transiently transfected with pcDNA3.0-AR and cultured in CDS medium. After 24 h of 10 nM DHT treatment, total RNA was extracted and RT-PCR was performed using NRIP, AR and β-actin primers. One representative data set from two independent experiments is shown. (C) The promoter activity of NRIP induced by DHT-activated AR. 293T cells were co-transfected with NRIP-P413-Luc and pcDNA3.0-AR or vector (pcDNA3.0) with pRL-CMV and cultured in CDS medium. After 24 h of 10 nM DHT treatment, luciferase activities were measured and normalized. The data are mean ± SD from three independent experiments. The fold change was measured by the luciferase activity of each experimental condition compared to that of the absence of the AR and DHT treatments. (D) AR influences the ARE region of the NRIP promoter. Three site-directed mutants were made by nucleotide substitutions at either ARE or GRE or both sites in NRIP-P413. Wild-type and mutant promoters were transfected with pcDNA3.0-AR and pRL-CMV into 293T cells with or without ligand treatment. The luciferase activities were measured as described above. Panel D(a) depicts the change of relative luciferase activity, which was measured by the luciferase activity of the NRIP-P413 promoter in the absence of AR and DHT treatments. Panel D(b) refers to luciferase activities with DHT relative to that of EtOH for each construct.
Figure 3.
Figure 3.
Sp1 regulation on NRIP promoter. (A) Sp1 activation of the NRIP promoter in Drosophila SL2 cells, which lacks endogenous Sp1. Sp1-negative SL2 cells were transfected with NRIP-P413 and increasing amounts of Sp1-expression plasmid (pPac-hSp1). The promoter activity of Sp1 was measured as described above. The fold change was measured by the luciferase activity of each experimental condition compared to that of the absence of the expression of Sp1. (B) NRIP promoter activity measured by a series of Sp1-binding site deletion mutants in 293T cells. A series of 5′-end NRIP-promoter deletion mutants were constructed and named NRIP-P283, NRIP-P256 and NRIP-P234. These lacked Sp1-1, Sp1-1/Sp1-2 and Sp1-1/Sp1-2-binding sites, respectively. Luciferase activities were measured in 293T cells as described in Figure 1B. (C) Sp1 influences the Sp1-2 site of the NRIP promoter. Site-directed mutagenesis at three Sp1-binding sites was generated from the NRIP-P413 promoter and named NRIP-P413/mSp1-1, NRIP-P413/mSp1-2 and NRIP-P413/mSp1-3, respectively. The point mutant sequences were underlined shown in left panel. These three Sp1 site-mutant promoters and pPac-hSp1 were transfected into Sp1-negative SL2 cells. (D) Dominant-negative Sp1 mutant inhibits NRIP promoter activity. Panel a: 293T cells were cotransfected with 0.5 μg of NRIP-P413 and the various doses of the dominant-negative Sp1 expression vector (pEBG DN-Sp1), and the total amount of plasmids was adjusted with empty pEBG vector. The reporter luciferase activity was measured as described above and normalized to the activity of pRL-TK. Panel b: Mithramycin A inhibits NRIP promoter activity. NRIP-P413 was transfected into either LNCaP or 293T cells, 24 h later, cells were incubated with the various concentrations of mithramycine A for another 24 h. Relative NRIP promoter activities (%) were counted as 100% in the cells without treatment of mithramycin A. Data are mean ± SD from three independent experiments. (E) AR and Sp1 cooperative regulation of NRIP transcription. LNCaP cells were infected with lentivirus encoding shRNA to AR and Sp1 individually or in combination; lentivirus-carrying shGFP was a control. Three days post-infection, total RNA was extracted and 5 µg of RNA was amplified by semi-quantitative RT-PCR using NRIP, PSA, AR, Sp1 and β-actin primers. One representative data set from three independent experiments is shown. The expression level of NRIP RNA quantified by UVP imaging was normalized to β-actin.
Figure 3.
Figure 3.
Sp1 regulation on NRIP promoter. (A) Sp1 activation of the NRIP promoter in Drosophila SL2 cells, which lacks endogenous Sp1. Sp1-negative SL2 cells were transfected with NRIP-P413 and increasing amounts of Sp1-expression plasmid (pPac-hSp1). The promoter activity of Sp1 was measured as described above. The fold change was measured by the luciferase activity of each experimental condition compared to that of the absence of the expression of Sp1. (B) NRIP promoter activity measured by a series of Sp1-binding site deletion mutants in 293T cells. A series of 5′-end NRIP-promoter deletion mutants were constructed and named NRIP-P283, NRIP-P256 and NRIP-P234. These lacked Sp1-1, Sp1-1/Sp1-2 and Sp1-1/Sp1-2-binding sites, respectively. Luciferase activities were measured in 293T cells as described in Figure 1B. (C) Sp1 influences the Sp1-2 site of the NRIP promoter. Site-directed mutagenesis at three Sp1-binding sites was generated from the NRIP-P413 promoter and named NRIP-P413/mSp1-1, NRIP-P413/mSp1-2 and NRIP-P413/mSp1-3, respectively. The point mutant sequences were underlined shown in left panel. These three Sp1 site-mutant promoters and pPac-hSp1 were transfected into Sp1-negative SL2 cells. (D) Dominant-negative Sp1 mutant inhibits NRIP promoter activity. Panel a: 293T cells were cotransfected with 0.5 μg of NRIP-P413 and the various doses of the dominant-negative Sp1 expression vector (pEBG DN-Sp1), and the total amount of plasmids was adjusted with empty pEBG vector. The reporter luciferase activity was measured as described above and normalized to the activity of pRL-TK. Panel b: Mithramycin A inhibits NRIP promoter activity. NRIP-P413 was transfected into either LNCaP or 293T cells, 24 h later, cells were incubated with the various concentrations of mithramycine A for another 24 h. Relative NRIP promoter activities (%) were counted as 100% in the cells without treatment of mithramycin A. Data are mean ± SD from three independent experiments. (E) AR and Sp1 cooperative regulation of NRIP transcription. LNCaP cells were infected with lentivirus encoding shRNA to AR and Sp1 individually or in combination; lentivirus-carrying shGFP was a control. Three days post-infection, total RNA was extracted and 5 µg of RNA was amplified by semi-quantitative RT-PCR using NRIP, PSA, AR, Sp1 and β-actin primers. One representative data set from three independent experiments is shown. The expression level of NRIP RNA quantified by UVP imaging was normalized to β-actin.
Figure 4.
Figure 4.
AR and Sp1 associate on the NRIP promoter. (A) The association of AR and Sp1 on the endogenous NRIP promoter in LNCaP cells. Left Panel: ChIP assays were performed in LNCaP cells using primers specific to ARE or Sp1-2-binding sites (as described in Materials and Methods section) to assess AR and Sp1 association with the NRIP promoter with or without DHT. The DNA–protein complexes were then immunoprecipitated by anti-Sp1 and anti-AR and IgG (a negative control) antibodies separately and then subjected to semi-quantitative PCR. rIgG and mIgG represent rat and mouse IgG, respectively. Right Panel: to investigate potential interactions between AR and Sp1 at the NRIP promoter, re-ChIP analysis was performed using the chromatin extracts of the DHT-treated LNCaP cells immunoprecipitated with either anti-AR or anti-Sp1 antibodies. Anti-AR immunoprecipitants and anti-Sp1 immunoprecipitants were re-immunoprecipitated with antibodies to Sp1 or AR, respectively. Then DNAs were extracted and subjected to PCR. (B) The interaction of AR and Sp1 on the ectopic NRIP promoter in 293T cells. 293T cells were transiently transfected with the indicated promoter mutant constructs, pSG5-HA-Sp1 and pcDNA3.0-AR in the presence of DHT. ChIP assays were analyzed by anti-AR and anti-Sp1. (C) Interactions of AR, Sp1 and NRIP. The plasmids pSIN-flag-AR, pSG5-HA-hSp1 and pEGFP-NRIP were co-transfected into 293T cells, which were cultured in FBS medium. After 48 h, cell lysates were collected and immunoprecipitated with anti-GFP, anti-Flag and anti-HA antibodies for NRIP, AR and Sp1, respectively. IP products were subjected to western blotting using antibodies as indicated.
Figure 4.
Figure 4.
AR and Sp1 associate on the NRIP promoter. (A) The association of AR and Sp1 on the endogenous NRIP promoter in LNCaP cells. Left Panel: ChIP assays were performed in LNCaP cells using primers specific to ARE or Sp1-2-binding sites (as described in Materials and Methods section) to assess AR and Sp1 association with the NRIP promoter with or without DHT. The DNA–protein complexes were then immunoprecipitated by anti-Sp1 and anti-AR and IgG (a negative control) antibodies separately and then subjected to semi-quantitative PCR. rIgG and mIgG represent rat and mouse IgG, respectively. Right Panel: to investigate potential interactions between AR and Sp1 at the NRIP promoter, re-ChIP analysis was performed using the chromatin extracts of the DHT-treated LNCaP cells immunoprecipitated with either anti-AR or anti-Sp1 antibodies. Anti-AR immunoprecipitants and anti-Sp1 immunoprecipitants were re-immunoprecipitated with antibodies to Sp1 or AR, respectively. Then DNAs were extracted and subjected to PCR. (B) The interaction of AR and Sp1 on the ectopic NRIP promoter in 293T cells. 293T cells were transiently transfected with the indicated promoter mutant constructs, pSG5-HA-Sp1 and pcDNA3.0-AR in the presence of DHT. ChIP assays were analyzed by anti-AR and anti-Sp1. (C) Interactions of AR, Sp1 and NRIP. The plasmids pSIN-flag-AR, pSG5-HA-hSp1 and pEGFP-NRIP were co-transfected into 293T cells, which were cultured in FBS medium. After 48 h, cell lysates were collected and immunoprecipitated with anti-GFP, anti-Flag and anti-HA antibodies for NRIP, AR and Sp1, respectively. IP products were subjected to western blotting using antibodies as indicated.
Figure 5.
Figure 5.
NRIP feed-forward activity enhances its own gene activity in a dose-dependent manner. 293T cells were co-transfected with NRIP-P413-Luc (A) or PSA-Luc (B) with increasing amounts of NRIP expression plasmid, pcDNA3.0-AR, and pRL-CMV (as an internal control). Likewise, LNCaP cells were co-transfected with increasing amounts of NRIP expression plasmid, pRL-CMV, and NRIP-P413-Luc promoter (C) or PSA-Luc promoter (D). Twenty-four hours after transfection, cells were treated with DHT for 12 h and luciferase activities were measured and normalized. The data are mean ± SD from three independent experiments. (E) NRIP can associate with NRIP and PSA promoter by ChIP assay. ChIP assays were performed using DHT-treated LNCaP cells and chromatin extracts were immunoprecipitated by antibodies against NRIP. (F) NRIP associates with either AR or Sp1 to bind to NRIP and PSA promoters, respectively. Chromatin extracts from DHT-treated LNCaP cells were immunoprecipitated by anti-AR or anti-Sp1 antibody and then re-precipitated with antibody against NRIP. DNA was then extracted and amplified by PCR using primers for the ARE region in the NRIP or PSA promoters, separately. (G) LNCaP cells were transiently transfected with increasing amounts of NRIP expression plasmid (NRIP-Flag) and cultured in CDS medium containing 10 nM DHT. After 48 h, cellular RNAs were extracted and subjected to semi-quantitative RT-PCR using primers for NRIP-Flag, endogenous NRIP (endoNRIP), PSA, AR, actin.
Figure 6.
Figure 6.
NRIP stabilizes AR protein but has no effect on AR mRNA and AR nuclear translocation. (A) The effect of NRIP on AR mRNA. LNCaP cells were infected with LV-shNRIP (or LV-shLuc as control) in the presence or absence of DHT. Three days post-infection, total RNA was extracted and subjected to semi-quantitative RT-PCR using NRIP, AR, PSA or β-actin primers. (B) NRIP effects on proteasome-dependent AR protein degradation. Lentivirus encoding shNRIP infected LNCaP cells in the presence of DHT and with or without proteasome inhibitor (MG132) for 24 h. Cell lysates were analyzed and immunoblotted with anti-NRIP, AR and actin antibodies as indicated. (C) NRIP effects on AR protein stability. LNCaP cells were infected with LV-shNRIP or LV-shLuc. Three days after infection, cycloheximide (CHX) was added for the indicated time. The amounts of AR protein from the lysates of cells in the absence (upper panel) or presence (lower panel) of DHT were analyzed by western blotting using anti-AR and anti-tubulin (as a loading control) antibodies. The% of control indicates the AR amount at each time point relative to the control (without CHX treatment, set at 100). (D) AR stabilization by NRIP in a dose-dependent manner. 293T cells were co-transfected with 1 μg pcDNA3.0-AR, 0, 2 or 4 µg pNRIP-F0lag and 1 µg EGFP-C1 as transfection efficiency controls in a 6-well plate. Total plasmid DNAs were adjusted by pcDNA3.1. Cells were cultured in CDS medium. Forty-eight hours after transfection, cell lysates were subjected to western blotting using antibodies against AR, Flag (for NRIP), GFP and β-actin. (E) The subcellular location of AR by NRIP. LNCaP cells were infected with LV-shLuc and LV-shNRIP for 3 days in the presence of DHT. Cell lysates were separated by cytosol and nuclear fractionation and followed by western blot analysis. The expression level of AR protein was quantified by UVP imaging and normalized by tubulin for the cytosolic fraction and by PARP for the nuclear fraction. For AR stability analysis, proteins from shLuc-treated LNCaP cells were defined as 100%. The percentage of AR nuclear localization was calculated as cytosol/nucleus ratios in shLuc-treated or shNRIP-treated LNCaP cells.
Figure 7.
Figure 7.
(A) Three proposed models of NRIP gene regulation by AR and Sp1. (1) NRIP protein complexes AR which directly binds to the ARE site; (2) NRIP forms a complex with AR-Sp1 proteins through the AR protein, which indirectly binds to the Sp1 site of the NRIP promoter; (3) A loop forms between ARE and Sp1 sites of the NRIP promoter via the complex formation of AR-Sp1-NRIP. (B) NRIP feed-forward regulation activates its own expression and enhances AR-mediated PSA gene expression.

References

    1. Black BE, Paschal BM. Intranuclear organization and function of the androgen receptor. Trends Endocrinol. Metab. 2004;15:411–417. - PubMed
    1. Burnstein KL. Regulation of androgen receptor levels: implications for prostate cancer progression and therapy. J. Cell. Biochem. 2005;95:657–669. - PubMed
    1. Heinlein CA, Chang C. Androgen receptor (AR) coregulators: an overview. Endocr. Rev. 2002;23:175–200. - PubMed
    1. Reynolds MA, Kastury K, Groskopf J, Schalken JA, Rittenhouse H. Molecular markers for prostate cancer. Cancer Lett. 2007;249:5–13. - PubMed
    1. Kumar R, Wang RA, Barnes CJ. Coregulators and chromatin remodeling in transcriptional control. Mol. Carcinog. 2004;41:221–230. - PubMed

Publication types