. 2007 Nov 26;204(12):2935-48.
doi: 10.1084/jem.20071082. Epub 2007 Nov 5.

Jagged1-mediated Notch activation induces epithelial-to-mesenchymal transition through Slug-induced repression of E-cadherin

Affiliations

Jagged1-mediated Notch activation induces epithelial-to-mesenchymal transition through Slug-induced repression of E-cadherin

Kevin G Leong et al. J Exp Med. .

Abstract

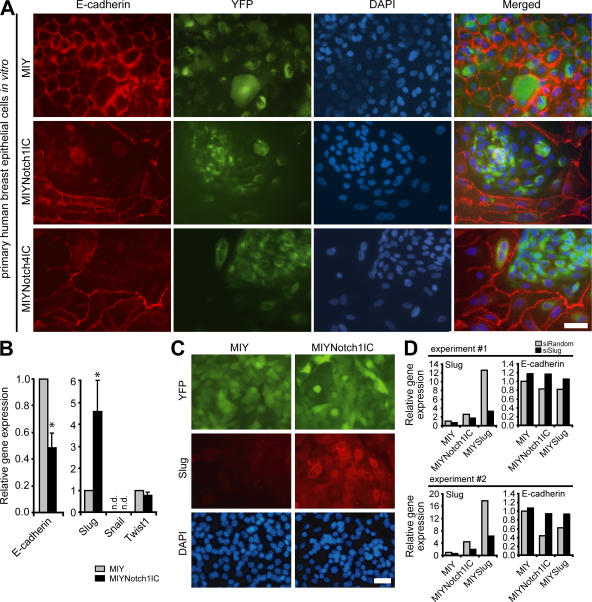
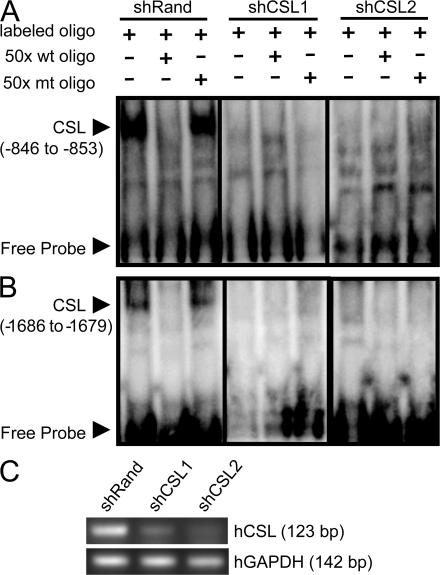
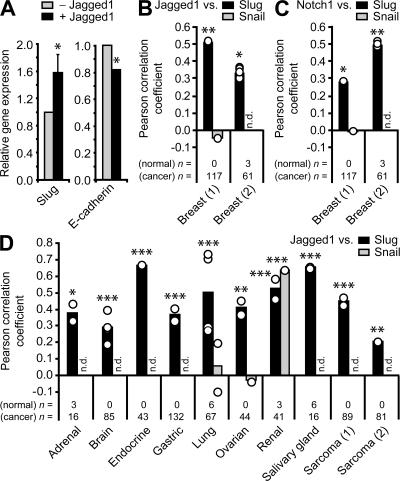
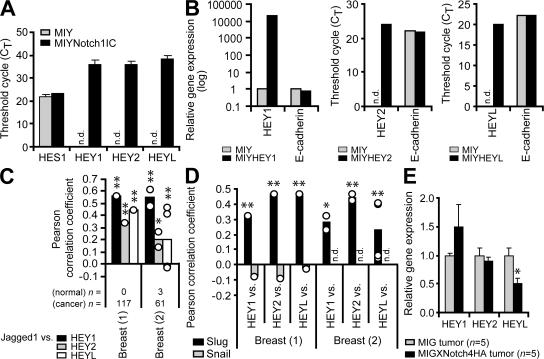
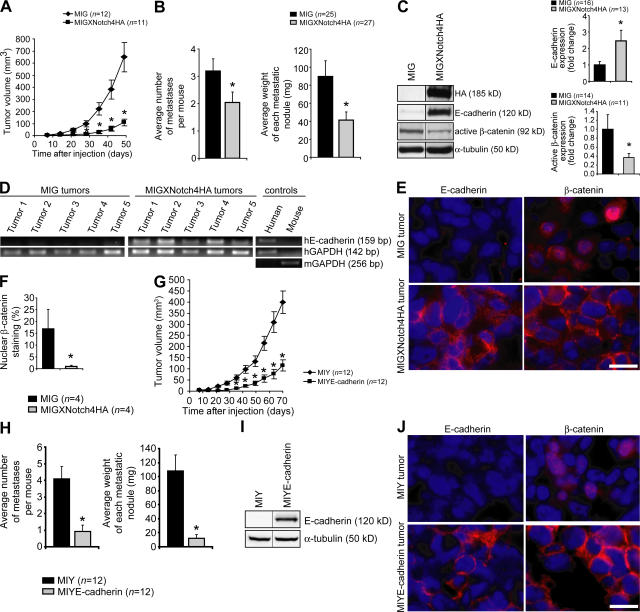
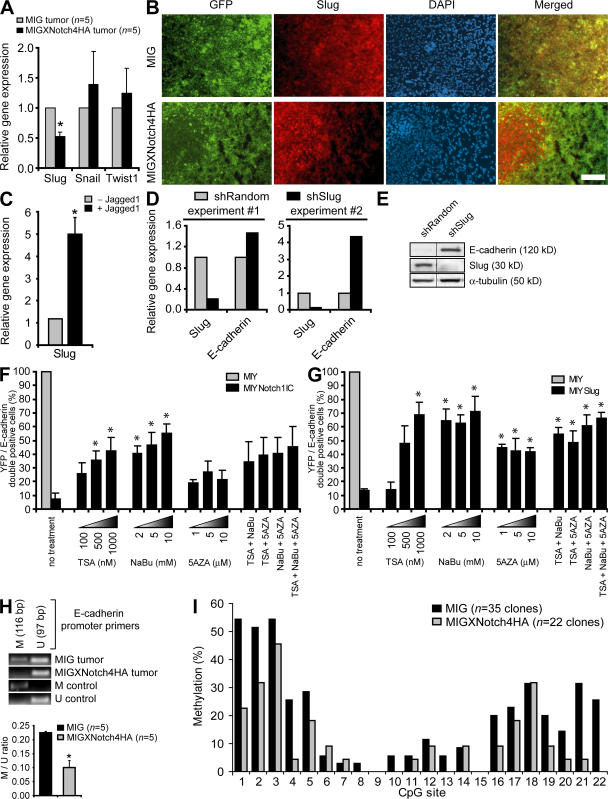
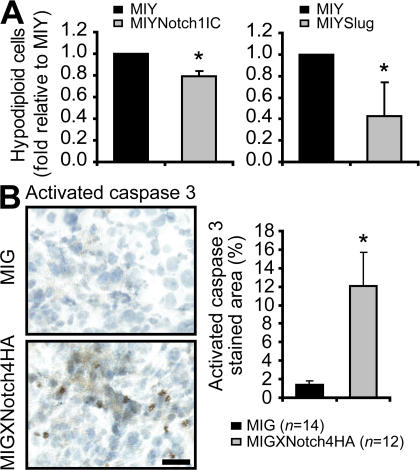
Aberrant expression of Jagged1 and Notch1 are associated with poor outcome in breast cancer. However, the reason that Jagged1 and/or Notch overexpression portends a poor prognosis is unknown. We identify Slug, a transcriptional repressor, as a novel Notch target and show that elevated levels of Slug correlate with increased expression of Jagged1 in various human cancers. Slug was essential for Notch-mediated repression of E-cadherin, which resulted in beta-catenin activation and resistance to anoikis. Inhibition of ligand-induced Notch signaling in xenografted Slug-positive/E-cadherin-negative breast tumors promoted apoptosis and inhibited tumor growth and metastasis. This response was associated with down-regulated Slug expression, reexpression of E-cadherin, and suppression of active beta-catenin. Our findings suggest that ligand-induced Notch activation, through the induction of Slug, promotes tumor growth and metastasis characterized by epithelial-to-mesenchymal transition and inhibition of anoikis.


Figures

Figure 1.
Figure 1.
Notch activation inhibits E-cadherin expression in human breast epithelial cells through the induction of Slug. (A) Immunofluorescent staining for E-cadherin (red), YFP (green), and DAPI (blue) in primary human breast epithelial cells transduced with MIY, MIYNotch1IC, or MIYNotch4IC. Bar, 50 μm. (B) qPCR for expression of E-cadherin, Slug, Snail, and Twist1 in MCF-10A cells transduced with MIY or MIYNotch1IC. Data are expressed as the relative gene expression level, with MIY control as the comparator, and are from three independent experiments (mean + SEM). *, P ≤ 0.05. (C) Immunofluorescent staining for Slug (red), YFP (green), and DAPI (blue) in MCF-10A cells transduced with MIY or MIYNotch1IC. Bar, 50 μm. (D) qPCR for expression of Slug and E-cadherin in MCF-10A cell lines (MIY, MIYNotch1IC, or MIYSlug) transiently transfected with siRandom or siSlug. Data from two independent experiments are shown and are expressed as the relative gene expression level with MIY control as the comparator. n.d., not detectable.
Figure 2.
Figure 2.
Slug is a direct target of Notch signaling. EMSA of nuclear lysates from MDA-MB-231 human breast cancer cells transduced with nonspecific shRNA (shRand) or two different shRNAs targeting CSL (shCSL1 and shCSL2). CSL consensus binding sites in the human Slug promoter (A, −846 to −853 [TATGGGAA]; and B, −1686 to −1679 [TGTGGGAA]) relative to the transcriptional start site were used as the 32P-labeled probe, and either nonradioactive wild-type or mutated (mt) oligonucleotides were used as competitors in 50-fold excess. The CSL–DNA protein complex and the free DNA probe are identified by arrows. (C) shRNA-mediated knockdown of CSL in MDA-MB-231 cell lines was verified by RT-PCR analysis.
Figure 3.
Figure 3.
Jagged1 and Slug expression are correlated in human breast epithelial cells and in primary human breast cancer. (A) qPCR for expression of Slug and E-cadherin in MCF-10A parental cells co-cultured with mouse endothelial cells transduced with MIY vector control (−Jagged1) or MIYJagged1 (+Jagged1). Human-specific primers were used to avoid amplification of mouse transcripts and limit analysis to MCF-10A cells. Data are expressed as the relative gene expression level, with the empty vector control co-culture (−Jagged1) as the comparator, and are from three independent experiments (mean + SEM). Slug: *, P ≤ 0.05; E-cadherin: *, P < 0.0001. (B–D) Expression correlations in primary human cancers. Pearson correlation coefficients were obtained from microarray datasets deposited in the Oncomine database. For each dataset, individual correlations between two genes of interest (as well as all possible correlations in cases where replicate probes were present in the microarray) are represented by open circles. Bars represent the mean Pearson correlation coefficient. The numbers of normal and cancer specimens included in the correlation analysis for each dataset are indicated. (B) Expression correlations between Jagged1 and Slug in primary human breast cancer. Jagged1 expression correlations with Snail are also shown. *, P < 0.01; **, P < 0.001. (C) Expression correlations between Notch1 and Slug in primary human breast cancer. Notch1 expression correlations with Snail are also shown. *, P < 0.01; **, P < 0.001. (D) Expression correlations between Jagged1 and Slug in various primary human cancers. Where available, expression correlations between Jagged1 and Snail are also shown. *, P ≤ 0.05; **, P < 0.01; ***, P < 0.001. n.d., not determined.
Figure 4.
Figure 4.
HEY genes are potential markers of human breast cancers that exhibit activation of the Jagged1–Notch–Slug signaling axis. (A) qPCR for Notch target genes (HES1, HEY1, HEY2, and HEYL) in MCF-10A MIY and MIYNotch1IC cell lines. Data shown are the mean threshold cycle number (CT) + SEM from three independent experiments. n.d., not detectable. (B) qPCR for gene expression in MCF-10A cells transduced with MIY, MIYHEY1, MIYHEY2, or MIYHEYL. Data show relative gene expression level or threshold cycle number (CT). n.d., not detectable. (C and D) Expression correlations in primary human breast cancers. Pearson correlation coefficients were obtained from microarray datasets deposited in the Oncomine database. For each dataset, correlations between two genes of interest (as well as all possible correlations in the event of replicate genes in the microarray) are represented by open circles. Bars represent the mean Pearson correlation coefficient. The number of normal and cancer specimens included in the correlation analysis for each dataset are indicated. n.d., not determined. (C) Expression correlations between Jagged1 and each of the HEY target genes in primary human breast cancer. *, P ≤ 0.05; **, P < 0.001. (D) Expression correlations between each of the HEY target genes and Slug in primary human breast cancer. Where available, expression correlations between each of the HEY target genes and Snail are also shown. *, P < 0.01; **, P < 0.001. (E) Semiquantitative RT-PCR for Notch target genes in MDA-MB-231 MIG and MIGXNotch4HA tumor xenografts. Data are expressed as the relative gene expression level with MIG control tumor as the comparator (mean + SEM). *, P ≤ 0.05. n.d.
Figure 5.
Figure 5.
Inhibition of ligand-induced Notch activation blocks breast tumor growth and metastasis, restores E-cadherin expression, and inactivates β-catenin in vivo. (A) Tumor growth curves for MDA-MB-231 cells transduced with MIG or MIGXNotch4HA grown as xenografts on the dorsa of immunodeficient mice. Data are presented as the mean ± SEM of the tumor volumes. *, P < 0.01. (B) Quantitation of metastases in MDA-MB-231 MIG and MIGXNotch4HA tumor-bearing mice. Data shown represent the mean number of metastases per mouse + SEM and the mean weight of each metastatic nodule + SEM. *, P ≤ 0.05. (C) Immunoblots for expression of XNotch4HA, E-cadherin, active β-catenin, and α-tubulin in MDA-MB-231 MIG and MIGXNotch4HA tumors. Protein expression was quantitated by densitometry and normalized to α-tubulin. Data shown represent mean + SEM. *, P ≤ 0.05. (D) RT-PCR for expression of human E-cadherin in MDA-MB-231 MIG and MIGXNotch4HA tumors. Human-specific primers were used to avoid amplification of mouse E-cadherin. (E) Immunofluorescent staining for E-cadherin (red), β-catenin (red), and DAPI (blue) in MDA-MB-231 MIG and MIGXNotch4HA tumors. Bar, 15 μm. (F) Quantitation of the proportion of cells exhibiting nuclear β-catenin staining in MDA-MB-231 MIG and MIGXNotch4HA tumors. Data shown represent mean + SEM. *, P ≤ 0.05. (G) Tumor growth curves for MDA-MB-231 cells transduced with MIY or MIYE-cadherin grown as xenografts on the dorsa of immunodeficient mice. Data are presented as the mean ± SEM of the tumor volumes. *, P < 0.001. (H) Quantitation of metastases in MDA-MB-231 MIY and MIYE-cadherin tumor-bearing mice. Data shown represent the mean number of metastases per mouse + SEM and the mean weight of each metastatic nodule + SEM. *, P < 0.001. (I) Immunoblots for expression of E-cadherin and α-tubulin in MDA-MB-231 MIY and MIYE-cadherin tumors. (J) Immunofluorescent staining for E-cadherin (red), β-catenin (red), and DAPI (blue) in MDA-MB-231 MIY and MIYE-cadherin tumors. Bar, 15 μm.
Figure 6.
Figure 6.
Restoration of E-cadherin expression by Notch inhibition is associated with Slug down-regulation and attenuation of E-cadherin promoter methylation. (A) qPCR for expression of Slug, Snail, and Twist1 in MDA-MB-231 MIG and MIGXNotch4HA tumors. Data are expressed as the relative gene expression level with MIG control tumors as the comparator (mean + SEM). *, P ≤ 0.01. (B) Immunofluorescent staining for Slug (red), GFP (green), and DAPI (blue) in MDA-MB-231 MIG and MIGXNotch4HA tumor xenografts. Yellow represents the overlap of GFP and Slug immunostaining. Bar, 100 μm. (C) qPCR for gene expression in MDA-MB-231 parental cells co-cultured with mouse endothelial cells transduced with MIY vector control (−Jagged1) or MIYJagged1 (+Jagged1). Human-specific primers were used to assay Slug specifically in MDA-MB-231 cells and avoid amplification of mouse transcripts. Data are expressed as the relative gene expression level, with the empty vector control co-culture (−Jagged1) as the comparator, and are from three independent experiments (mean + SEM). *, P ≤ 0.05. (D) qPCR for expression of Slug and E-cadherin in MDA-MB-231 cells transduced with shRandom or shSlug. Data from two independent experiments are shown and are expressed as the relative gene expression level with shRandom control as the comparator. (E) Immunoblot for expression of E-cadherin, Slug, and α-tubulin in MDA-MB-231 cells transduced with shRandom or shSlug. (F) Quantitation of the proportion of MCF-10A cells transduced with MIY or MIYNotch1IC that are positive for both YFP and E-cadherin. Cells were treated with TSA (100/500/1000 nM), NaBu (2/5/10 mM), or 5AZA (1/5/10 μM) alone or in combination, and E-cadherin expression was assessed 3 d after treatment by immunofluorescent microscopy. Data shown represent mean + SEM of at least three independent experiments. *, P ≤ 0.05. (G) Quantitation of the proportion of MCF-10A cells transduced with MIY or MIYSlug that are positive for both YFP and E-cadherin. Cells were treated with TSA (100/500/1000 nM), NaBu (2/5/10 mM), or 5AZA (1/5/10 μM) alone or in combination. Data shown represent mean + SEM of at least three independent experiments. *, P ≤ 0.05. (H) MSP to assess methylation status of the E-cadherin promoter in MDA-MB-231 tumors. Primers specific for methylated (M) or unmethylated (U) E-cadherin promoter were used. Amplified M and U products were quantitated by densitometry and expressed as the M/U ratio. Data shown represent mean + SEM. *, P < 0.001. (I) Genomic bisulfite sequencing to assess methylation status of the E-cadherin promoter in MDA-MB-231 tumors (MIG, n = 35 clones from five tumors; MIGXNotch4HA, n = 22 clones from three tumors). A total of 22 CpG sites within the E-cadherin proximal promoter (−104 to +118) were analyzed. Data shown represent the percentage of methylation observed at each CpG site.
Figure 7.
Figure 7.
The Notch–Slug signaling axis inhibits anoikis of human breast cells. (A) Anoikis assay to assess cell death in MCF-10A cell lines (MIY, MIYNotch1IC, and MIYSlug). The fraction of hypodiploid cells was determined by flow cytometry, and the data representing the mean + SEM of three independent experiments are expressed as the fold change in hypodiploid cells relative to MIY control. MIYNotch1IC: *, P < 0.01; MIYSlug: *, P ≤ 0.05. (B) Immunohistochemical staining for activated caspase 3 in implanted MDA-MB-231 MIG and MIGXNotch4HA tumors. Data representing the mean + SEM are shown as the proportion of the activated caspase 3–stained area compared with the total tumor area. *, P = 0.012. Bar, 25 μm.

References

    1. Mumm, J.S., and R. Kopan. 2000. Notch signaling: from the outside in. Dev. Biol. 228:151–165. - PubMed
    1. Leong, K.G., and A. Karsan. 2006. Recent insights into the role of Notch signaling in tumorigenesis. Blood. 107:2223–2233. - PubMed
    1. Gallahan, D., C. Jhappan, G. Robinson, L. Hennighausen, R. Sharp, E. Kordon, R. Callahan, G. Merlino, and G.H. Smith. 1996. Expression of a truncated Int3 gene in developing secretory mammary epithelium specifically retards lobular differentiation resulting in tumorigenesis. Cancer Res. 56:1775–1785. - PubMed
    1. Hu, C., A. Dievart, M. Lupien, E. Calvo, G. Tremblay, and P. Jolicoeur. 2006. Overexpression of activated murine Notch1 and Notch3 in transgenic mice blocks mammary gland development and induces mammary tumors. Am. J. Pathol. 168:973–990. - PMC - PubMed
    1. Callahan, R., and S.E. Egan. 2004. Notch signaling in mammary development and oncogenesis. J. Mammary Gland Biol. Neoplasia. 9:145–163. - PubMed

Publication types

MeSH terms