. 2007 Nov 5;179(3):467-83.
doi: 10.1083/jcb.200708205.

Inheritance of cortical ER in yeast is required for normal septin organization

Affiliations

Inheritance of cortical ER in yeast is required for normal septin organization

Christopher J R Loewen et al. J Cell Biol. .

Abstract

How cells monitor the distribution of organelles is largely unknown. In budding yeast, the largest subdomain of the endoplasmic reticulum (ER) is a network of cortical ER (cER) that adheres to the plasma membrane. Delivery of cER from mother cells to buds, which is termed cER inheritance, occurs as an orderly process early in budding. We find that cER inheritance is defective in cells lacking Scs2, a yeast homologue of the integral ER membrane protein VAP (vesicle-associated membrane protein-associated protein) conserved in all eukaryotes. Scs2 and human VAP both target yeast bud tips, suggesting a conserved action of VAP in attaching ER to sites of polarized growth. In addition, the loss of either Scs2 or Ice2 (another protein involved in cER inheritance) perturbs septin assembly at the bud neck. This perturbation leads to a delay in the transition through G2, activating the Saccharomyces wee1 kinase (Swe1) and the morphogenesis checkpoint. Thus, we identify a mechanism involved in sensing the distribution of ER.


Figures
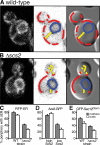
Figure 1.
Figure 1.
Role of Scs2 in the formation of cER. (A and B) cER is reduced by Δscs2. Single typical wild-type (A) and Δscs2 (B) cells expressing RFP-ER, a fluorescent reporter for ER membranes, with a cER amount close to the population means. Fluorescence images (left) and transmission images (right) are accompanied by inverted fluorescence images (middle) on which the three subdomains of ER are drawn: nuclear envelope (blue), cytoplasmic (yellow), and cER (red). The proportion of cell periphery with cER in the mother and bud is 63% and 66% (A) and 40% and 16% (B), respectively. (C–E) Quantitative effect of altered levels of Scs2 on cER assessed by fluorescence microscopy. The proportion of cell perimeter with associated cER was assessed for populations of mothers and buds separately using three different markers of the ER: RFP-ER (C), Are2-GFP (D), and GFP-Sec12 C-terminal domain (Sec12Cterm; E). In C and E, wild-type cells were compared with Δscs2 cells. In D, TLY251 cells were grown to induce or repress SCS2. Error bars indicate SEM.
Figure 2.
Figure 2.
Identification of cER in wild-type and Δscs2 cells by electron microscopy. (A–D) Electron micrographs of typical unbudded (A and B) and budding (C and D) GAL>SCS2 (TLY251) cells grown to induce (A and C) or repress (B and D) the expression of Scs2. Electron micrographs were annotated by indicating segments of cER in red (top right), which is also shown with the whole cell outlines in black (bottom right). The proportion of cell periphery with cER is 33% (A), 15% (B), 27% (C; mother 24%, bud 35%), and 11% (D; mother 9%, bud 15%). (E) Quantitation from electron micrographs of the effect of low Scs2 on cER in unbudded cells. (left) cER in electron micrographs of GAL>SCS2 cells (in which levels of Scs2 are high in galactose and low in dextrose). Repression of SCS2 reduced cER to 42% of that seen with induction, which was statistically significant (P < 10−7 by t test). (right) Wild-type cells (BY4742) were grown in galactose and dextrose. Amounts of cER were the same as each other (P = 0.56 by t test) and were the same as GAL>SCS2 cells with induced SCS2 (P = 0.40 and P = 0.74, respectively), implying that the effect on GAL>SCS2 is specific to Scs2 and that the overexpression of Scs2 does not increase cER above wild-type levels. (F) Differential effect of low Scs2 on cER in buds and mothers. Electron micrographs of budding profiles of GAL>SCS2 cells were quantified as in E. Low levels of Scs2 were associated with a decrease of cER: buds = 31% wild type, and mother cells = 53% wild type. Error bars indicate SEM. Bars, 1 μm.
Figure 3.
Figure 3.
Interaction of SCS2 with ICE2 in cER inheritance. (A) Effect of combining mutations of SCS2 and Δice2. The proportion of periphery with apposed cER in mothers (black bars) and buds (white bars) was assessed in wild-type (BY4741) yeast, strains lacking functional Scs2 (either deleted [Δscs2] or repressed [scs2r]), and a double mutant strain. Compared with Δscs2 and scs2r, Δice2 scs2r buds had less cER (- indicates P ≤ 0.01 by t test; Ø indicates P > 0.1). Error bars represent SEM. (B) Δice2 scs2r cells expressing RFP-ER, plus transmission (Tm) image. Punctate accumulations of cytoplasmic ER (arrowheads) were seen in buds but did not colocalize with bud tips. Arrows in the mothers of these cells indicate the axis of budding. (C) SGA analysis for SCS2 and ICE2 and genes implicated in cER inheritance. The strength of interaction is indicated by the color scale (gray, no data). (D) Growth defect of Δscs2Δice2 cells isolated by tetrad analysis. Cells were spotted onto agar plates in 10-fold serial dilutions and grown for 2 d at 30°C on minimal medium.
Figure 4.
Figure 4.
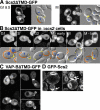
Targeting by Scs2 and VAP to sites of polarized growth. (A) Scs2ΔTMD-GFP expressed in wild-type cells. In a minority of cells, Scs2ΔTMD-GFP targets the tips of small buds (left) or sites of recent cytokinesis, likely incipient bud sites (right). The locations of targeted construct are indicated on transmission images: yellow, sites of polarized growth (bud tip and incipient bud sites); red, cortex; and blue, nucleolus, which was confirmed by costaining with a nucleolar reporter (Cgr1-RFP; not depicted). (B) A gallery of Δscs2 cells expressing Scs2ΔTMD-GFP, with typical localizations varying with the cell cycle. Transmission images annotated as in A except yellow includes the bud neck, distal pole of mother cell, and occasional peripheral puncta. (C) A gallery of wild-type cells expressing VAP-BΔTMD-GFP. Similar targeting was shown by VAP-AΔTMD-GFP and VAP-B(P56S)ΔTMD-GFP (not depicted). (D) GFP-Scs2 (full length) expressed in wild-type cells. Arrows indicate polarized targeting.
Figure 5.
Figure 5.
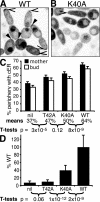
Molecular determinants of Scs2 targeting and cER formation. (A) Inverted image of Δscs2 cells expressing Scs2ΔTMD-GFP synchronized in S phase by treatment with 300 mM HU for 4 h. Under these conditions, there is targeting to the tips of virtually all buds (open arrowheads) and the distal pole of some mothers (closed arrowheads). (B) Cells as in A expressing K40AΔTMD-GFP. Polarized targeting is almost completely lost, with a rare small area of weak targeting indicated. Nucleolar targeting is also considerably reduced, indicating that the nucleolar localization sequence is formed by the cluster of positive charges around the conserved FFAT-binding surface of Scs2 (Endo et al., 1989; Kaiser et al., 2005; Loewen and Levine, 2005). (C) The effect of mutations near the FFAT-binding site on rescue of cER by Scs2. Δscs2 cells (CLY3 with RFP-ER integrated at LEU2) were transformed with an empty plasmid (nil), plasmids expressing wild-type Scs2 (WT), or mutants T42A and K40A. The proportion of cell periphery with apposed cER in mothers (black bars) and buds (white bars) was assessed. Numbers refer to the means of cER in mothers and buds together, and t test scores compare the effect of different plasmids. (D) Complementation of the Δscs2Δice2 growth phenotype with variants of Scs2. Heterozygous diploid cells were transformed with the same plasmids as in C, and random spore analysis was performed to generate haploid double mutants. Rescue was quantitated by measuring colony size for at least 50 colonies per plasmid and is normalized to rescue by wild-type Scs2. Error bars indicate SEM.
Figure 6.
Figure 6.
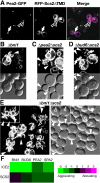
Role of polarisome in targeting Scs2 to sites of polarized growth. (A) Colocalization of Pea2-GFP with RFP-Scs2ΔTMD. Single images are shown together with a merged image in which GFP and RFP are colored green and purple, respectively, with colocalization (white) at bud tips (arrowheads) and a site of recent cytokinesis (arrows). (B–E) ER in polarisome mutants visualized using RFP-ER: Δbni1 (B), Δpea2Δscs2 (C), Δbud6Δscs2 (D), and Δbni1Δscs2 (E). Transmission images are also shown. In all of B–E, cortical regions of buds lack cER (closed arrowheads). Associated with Δbni1 (B and E), cER is missing from bud tips; cER is also absent from distal poles of Δbni1Δscs2 mother cells (open arrowheads placed in mother cells; E). Δbud6Δscs2 buds also contain excess strands of cytoplasmic ER (arrows; D). (F) SGA analysis identifies aggravating interactions between ICE2 and components of the polarisome.
Figure 7.
Figure 7.
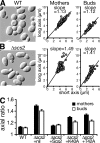
Δscs2 cells are elongated. (A and B) Cell shape of wild-type (WT; A) and Δscs2 cells (B). Transmission images of fields of cells were processed as described in Materials and methods to measure cell length and width, here plotted for mother cells and daughters separately, together with lines of best fit. (C) The axial ratios (length/width) were calculated for mother cells and buds of wild-type and Δscs2 strains carrying a plasmid, either empty or with Scs2, wild-type, or K40A or T42A mutants. The elongation of buds correlated with but was less than elongation in mothers. Error bars represent SEM.
Figure 8.
Figure 8.
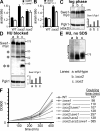
Interaction of SCS2 and ICE2 with SWE1. (A) Axial ratios of wild-type, Δscs2, and Δice2 cells compared with their Δswe1 counterparts. Δswe1 led to statistically significant rounding up for wild type (P = 0.0002 by t test) and Δscs2 (P < 10−8 by t test) but not for Δice2. (B) Axial ratios of wild-type and Δscs2 cells compared with the same strains overexpressing Hsl7 from the GAL1/10 promoter. Error bars represent SEM. (C) Cell lysates from log-phase cultures of wild-type, Δscs2, and Δice2 strains in which the genomic copy of Swe1 was tagged with a 12x myc cassette were separated on SDS-PAGE gels and immunoblotted for c-myc. Equal loading of samples was ensured by blotting for phosphoglycerokinase (Pgk1). The main full-length Swe1-myc band was quantified relative to Pgk1. (D) The same yeast strains were treated with HU for 4 h and analyzed for total Swe1-myc content as in C. Asterisks indicate major reproducible breakdown products. (E) Analysis of Swe1-myc in HU-treated samples from D on polyacrylamide gels without SDS. The different forms of Swe1-myc indicated are fastest migrating (arrowhead), partially hyperphosphorylated slower migrating forms (curly bracket), and smear of maximally hyperphosphorylated forms rising above that in lane a (square bracket; Harvey et al., 2005). Blots are from a single representative of three similar experiments. In C–E., molecular weights are indicated, and Pgk1 migrates at 44 kD. (F) The effect of deleting SWE1 on growth rates and doubling times of wild-type, Δscs2, Δice2, and Δscs2Δice2 strains assayed in rich medium as described in Materials and methods.
Figure 9.
Figure 9.
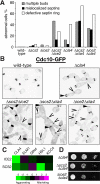
The effects of Δscs2 and Δice2 on organization of the septin Cdc10. (A) Quantification of septin localization, assembly, and multibudded phenotype in mutant strains with the endogenous septin Cdc10 tagged with GFP. Strains were grown overnight in rich medium and diluted back into minimal medium for 8 h. Over 100 cells were counted for each strain, and results are plotted as the percentage of abnormal cells. (B) Distribution of Cdc10-GFP in wild-type, Δcla4, Δscs2Δice2, Δscs2Δcla4, and Δice2Δcla4 strains from A. Note the mislocalized septins usually found at bud tips (closed arrowheads) and defective or absent septin rings (open arrowheads). (C) Results of SGA analysis for ICE2 and SCS2 with bud neck kinases that affect septin function. (D) Growth defect of Δscs2Δcla4 and Δice2Δcla4 strains isolated by tetrad analysis, assayed as in Fig. 3 D.

References

    1. Arkowitz, R.A., and N. Lowe. 1997. A small conserved domain in the yeast Spa2p is necessary and sufficient for its polarized localization. J. Cell Biol. 138:17–36. - PMC - PubMed
    1. Ayscough, K.R., J. Stryker, N. Pokala, M. Sanders, P. Crews, and D.G. Drubin. 1997. High rates of actin filament turnover in budding yeast and roles for actin in establishment and maintenance of cell polarity revealed using the actin inhibitor latrunculin-A. J. Cell Biol. 137:399–416. - PMC - PubMed
    1. Bardo, S., M.G. Cavazzini, and N. Emptage. 2006. The role of the endoplasmic reticulum Ca2+ store in the plasticity of central neurons. Trends Pharmacol. Sci. 27:78–84. - PubMed
    1. Barral, Y., M. Parra, S. Bidlingmaier, and M. Snyder. 1999. Nim1-related kinases coordinate cell cycle progression with the organization of the peripheral cytoskeleton in yeast. Genes Dev. 13:176–187. - PMC - PubMed
    1. Beilharz, T., B. Egan, P.A. Silver, K. Hofmann, and T. Lithgow. 2003. Bipartite signals mediate subcellular targeting of tail-anchored membrane proteins in Saccharomyces cerevisiae. J. Biol. Chem. 278:8219–8223. - PubMed

Publication types