. 2007 Nov;64(11):1281-91.
doi: 10.1001/archpsyc.64.11.1281.

Morphologic features of the amygdala and hippocampus in children and adults with Tourette syndrome

Affiliations

Morphologic features of the amygdala and hippocampus in children and adults with Tourette syndrome

Bradley S Peterson et al. Arch Gen Psychiatry. 2007 Nov.

Abstract

Context: Limbic portions of cortical-subcortical circuits are likely involved in the pathogenesis of Tourette syndrome (TS). They are anatomically, developmentally, neurochemically, and functionally related to the basal ganglia, and the basal ganglia are thought to produce the symptoms of tics, obsessive-compulsive disorder, and attention-deficit/hyperactivity disorder that commonly affect persons with TS.

Objective: To study the morphologic features of the hippocampus and amygdala in children and adults with TS.

Design: A cross-sectional, case-control study using anatomical magnetic resonance imaging.

Setting: University research center.

Participants: A total of 282 individuals (154 patients with TS and 128 controls) aged 6 to 63 years.

Main outcome measures: Volumes and measures of surface morphologic features of the hippocampus and amygdala.

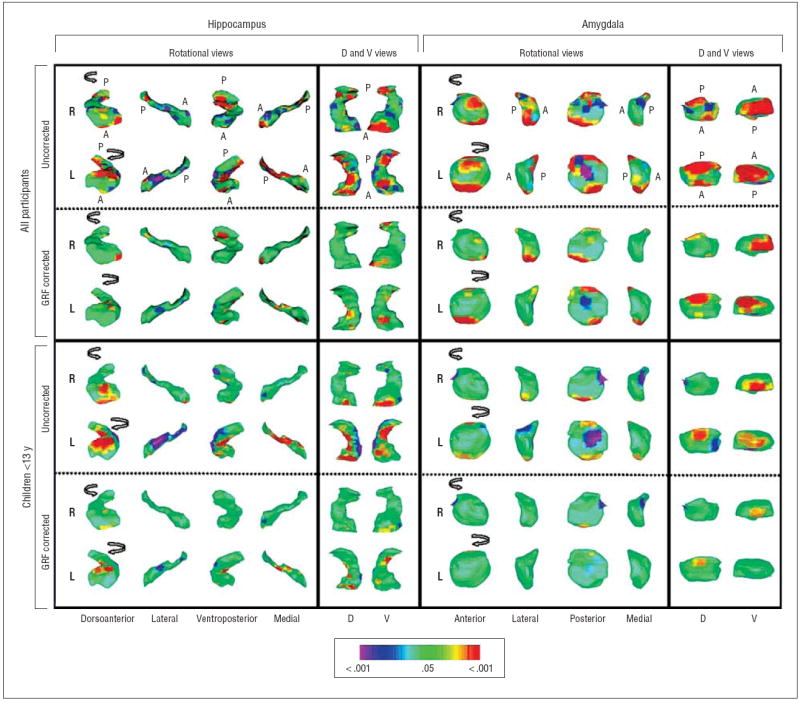
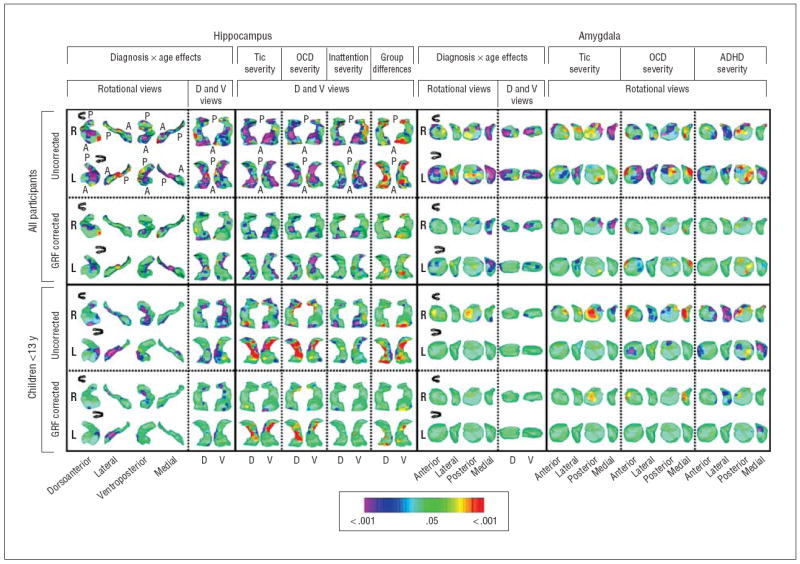
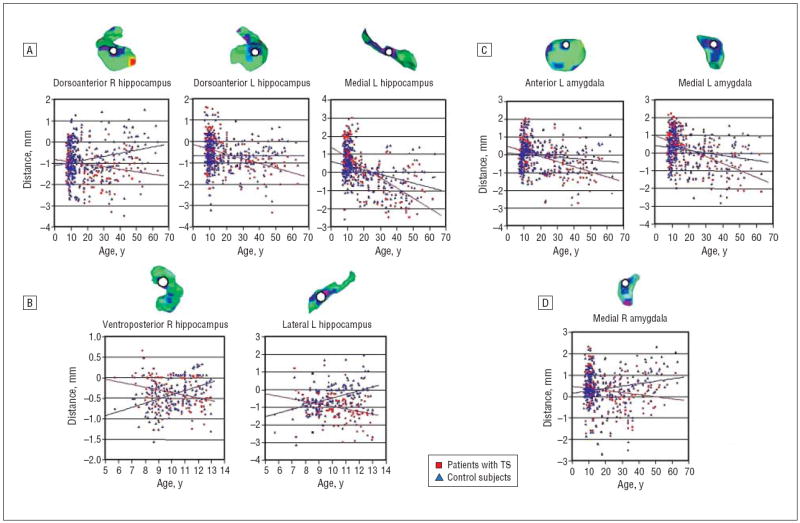
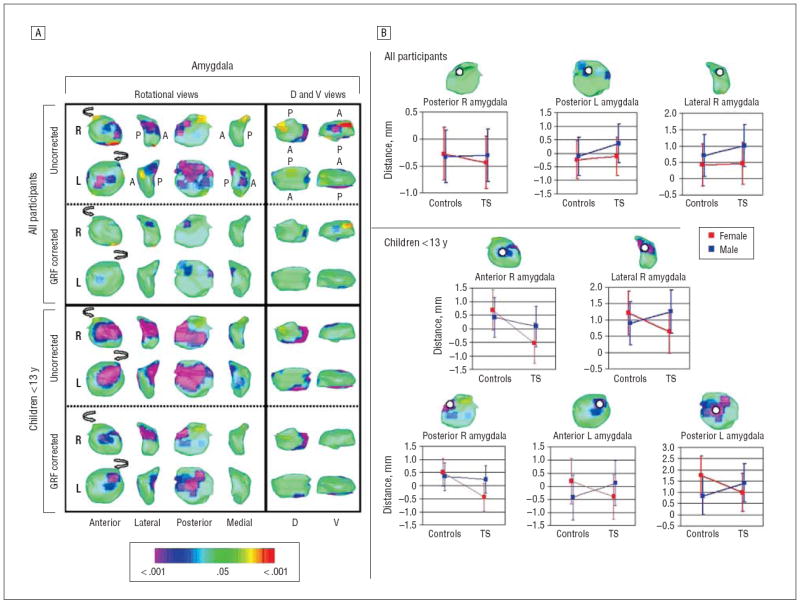
Results: The overall volumes of the hippocampus and amygdala were significantly larger in the TS group. Surface analyses suggested that the increased volumes in the TS group derived primarily from the head and medial surface of the hippocampus (over the length of the dentate gyrus) and the dorsal and ventral surfaces of the amygdala (over its basolateral and central nuclei). Volumes of these subregions declined with age in the TS group but not in controls, so the subregions were significantly larger in children with TS but significantly smaller in adults with TS than in their control counterparts. In children and adults, volumes in these subregions correlated inversely with the severity of tic, obsessive-compulsive disorder, and attention-deficit/hyperactivity disorder symptoms, suggesting that enlargement of the subregions may have a compensatory and neuromodulatory effect on tic-related symptoms.

Conclusion: These findings are consistent with the known plasticity of the dentate gyrus and with findings from previous imaging studies suggesting the presence of failed compensatory plasticity in adults with TS who have not experienced the usual decline in symptoms during adolescence.


Figures

Figure 1
Figure 1
Hippocampus and amygdala morphologic features. The anteriormost slice of the amygdala was defined as the one in which the anterior commissure first crosses the midline; its posterior region was defined by the appearance of the hippocampus inferiorly and the gyrus uncinatus. The transition between the amygdala and the hippocampus was determined by drawing a line connecting the inferior horn of the lateral ventricle to the amygdaloid sulcus. When the sulcus was not obvious, a straight horizontal line connecting the inferior horn of the lateral ventricle to the surface on the uncus was used as the transition. The posteriormost slice of the hippocampus was defined as the last slice in which the crus of the fornix and the fimbria of the hippocampal formation could be delineated. A, Dorsal view of the subregions of the left hippocampus. B, Coronal sections of the subregions of the right amygdala. a, Sagittal view, with slices of the corresponding coronal views indicated (broken vertical lines). b-d, Coronal views, from anterior to posterior. BN indicates basal nucleus; CA1 to CA4, the fields of the cornu ammonis; CoN, cortical nucleus; CeN, central nucleus; CS, collateral sulcus; DG, dentate gyrus; DH, digitationes hippocampi; EA, entorhinal area; ES, endorhinal sulcus; GA, gyrus ambiens; H, hippocampus; HB, hippocampal body; HH, head of the hippocampus; HT, hippocampal tail; LN, lateral nucleus; MN, medial nucleus; THLV, temporal horn of the lateral ventricle; TS, terminal segment of the hippocampal tail.
Figure 2
Figure 2
Diagnosis main effects in surface morphologic features. The right (R) and left (L) hippocampus and amygdala are shown in rotating views and in their dorsal (D) and ventral (V) perspectives. Anterior (A) and posterior (P) directions are indicated in the top 2 rows. Arrows in the rotational views show the direction of rotation. The statistical model included the main effect of diagnosis and the covariates of age, sex, and lifetime diagnoses of obsessive-compulsive disorder and attention-deficit/hyperactivity disorder. The color bar indicates the color coding for P values associated with the main effect of diagnosis, with warmer colors (yellow and red) indicating protruding surfaces, presumably from larger underlying volumes, and cooler colors (blue and purple) indicating indented surfaces and presumably smaller underlying volumes in those regions. The gaussian random field (GRF)–corrected images tell us which voxels in the image survive rigorous correction for multiple comparisons. Because the corrections are so rigorous, they may not inform us completely about the underlying spatial or anatomical configuration of the statistical effects being modeled (because the anatomical location of the voxels identified in this map are vulnerable to the effects of statistical thresholding that can cause them to shift in location). For accurately identifying anatomical subregions that carry the effect being modeled, GRF-uncorrected images are preferred; for identifying voxels involved in the effect with the greatest statistical certainty, GRF-corrected images are preferred.
Figure 3
Figure 3
Diagnosis × age interactions and symptom correlates in surface morphologic features. Orientations and abbreviations are as described in Figure 2. The statistical model for the diagnosis × age interaction included the main effect of diagnosis and the covariates of age, sex, and lifetime diagnoses of obsessive-compulsive disorder (OCD) and attention-deficit/hyperactivity disorder (ADHD). The color bar indicates the color coding for P values associated with the interaction term for symptom severity calculated at each point on the surfaces of the hippocampus and amygdala. In the hippocampus, age × diagnosis effects were detected over the head and medial surface in all participants bilaterally, whereas in the children they were detected only over the lateral surface. Scatterplots of these effects indicated that the head and medial surfaces were larger in children with Tourette syndrome (TS) but declined with age, so they were substantially smaller in adults with TS (Figure 4). The larger sizes of these regions, detected as a significant main effect (Figure 2), were carried by the disproportionate number of children in the sample. Scatterplots also indicated that the lateral aspect of the hippocampus increased with age in controls but declined with age in children with TS (Figure 4). Similar age × diagnosis interactions were detected over the medial surface of the amygdala bilaterally, again with a decline with age in patients with TS, particularly in adults, compared with controls. The statistical models for assessment of the morphologic correlates of symptom severity included the main effect of severity in a single domain (ie, tics, OCD, or ADHD) and age as a covariate. For ease of comparison of findings in the hippocampus with the regions of significant group differences, the dorsal and ventral views of the main effect of diagnosis are also shown. Tic severity correlated significantly and inversely with morphologic abnormalities over the head and medial border of the hippocampus bilaterally and over the lateral surface of the left amygdala and medial surface of the right amygdala in an analysis of all the participants. In an analysis of children only, a similar pattern of correlations was detected, although with statistically weaker effects. In addition, the children exhibited strong positive correlations with tic severity over the medial body of the left hippocampus and over the posterior surface of the right amygdala. The severity of OCD symptoms correlated inversely with morphologic abnormalities of the medial border of the tail of the hippocampus bilaterally and inversely with the lateral surface of the amygdala in analyses of all the participants. In analyses of children only, positive correlations were detected over much of the medial body of the left hippocampus and medial tail of the right amygdala. The severity of ADHD symptoms correlated inversely with the morphologic features of the head of the hippocampus bilaterally with the lateral and medial borders of the amygdala.
Figure 4
Figure 4
Scatterplots for diagnosis × age interactions. Regions where this interaction survived gaussian random field correction are probed (white circles). A, Scatterplots for diagnosis × age interactions. Regions where this interaction survived gaussian random field correction are probed (white circles). Distance is calculated as millimeters from the surface of the template hippocampus or amygdala. A, Effects in the hippocampus for all participants. B, Effects in the hippocampus of children younger than 13 years. C, Effects in the amygdala of all participants. D, Effects in the amygdala of children younger than 13 years. L indicates left, R, right; TS, Tourette syndrome. In all analyses, older participants, on average, have reduced local volumes compared with control subjects of comparable ages.
Figure 5
Figure 5
Diagnosis × sex interactions in surface morphologic features. Orientations and abbreviations are as described in Figures 2 and 4. A, The statistical model included the main effect of diagnosis; the covariates of age, sex, and lifetime diagnoses of obsessive-compulsive disorder and attention-deficit/hyperactivity disorder; and the interaction of diagnosis × sex. The color bar indicates the color coding for P values associated with the interaction term calculated at each point on the surface of the amygdala. No significant interaction effects were detected in the hippocampus (not shown). The maps for the amygdala were unchanged when including the diagnosis × age interaction. Significant diagnosis × sex effects that survived gaussian random field correction were not detected in the hippocampus but were prominent in the amygdala, particularly in its posterior and lateral surfaces and in children. B, Scatterplots indicated that these sex-specific group differences were driven by local volumes in males with Tourette syndrome (TS) that were either similar to or larger than those in control males and by volumes in females with TS that were smaller than those in control females. These tended to reverse in the TS group the direction of sex differences present in controls. Error bars represent SD.

References

    1. Pauls DL. An update on the genetics of Gilles de la Tourette syndrome. J Psychosom Res. 2003;55(1):7–12. - PubMed
    1. Peterson BS, Staib L, Scahill L, Zhang H, Anderson C, Leckman JF, Cohen DJ, Gore JC, Albert J, Webster R. Regional brain and ventricular volumes in Tourette syndrome. Arch Gen Psychiatry. 2001;58(5):427–440. - PubMed
    1. Peterson BS, Thomas P, Kane MJ, Scahill L, Zhang H, Bronen R, King RA, Leckman JF, Staib L. Basal ganglia volumes in patients with Gilles de la Tourette syndrome. Arch Gen Psychiatry. 2003;60(4):415–424. - PubMed
    1. Parent A, Hazrati LN. Functional anatomy of the basal ganglia, I: the corticobasal ganglia-thalamo-cortical loop. Brain Res Brain Res Rev. 1995;20(1):91–127. - PubMed
    1. Fudge JL, Kunishio K, Walsh P, Richard C, Haber SN. Amygdaloid projections to ventromedial striatal subterritories in the primate. Neuroscience. 2002;110(2):257–275. - PubMed

Publication types