. 2007 Nov 6;5(11):e292.
doi: 10.1371/journal.pbio.0050292.

A sex-ratio meiotic drive system in Drosophila simulans. I: an autosomal suppressor

Affiliations

A sex-ratio meiotic drive system in Drosophila simulans. I: an autosomal suppressor

Yun Tao et al. PLoS Biol. .

Abstract

Sex ratio distortion (sex-ratio for short) has been reported in numerous species such as Drosophila, where distortion can readily be detected in experimental crosses, but the molecular mechanisms remain elusive. Here we characterize an autosomal sex-ratio suppressor from D. simulans that we designate as not much yang (nmy, polytene chromosome position 87F3). Nmy suppresses an X-linked sex-ratio distorter, contains a pair of near-perfect inverted repeats of 345 bp, and evidently originated through retrotransposition from the distorter itself. The suppression is likely mediated by sequence homology between the suppressor and distorter. The strength of sex-ratio is greatly enhanced by lower temperature. This temperature sensitivity was used to assign the sex-ratio etiology to the maturation process of the Y-bearing sperm, a hypothesis corroborated by both light microscope observations and ultrastructural studies. It has long been suggested that an X-linked sex-ratio distorter can evolve by exploiting loopholes in the meiotic machinery for its own transmission advantage, which may be offset by other changes in the genome that control the selfish distorter. Data obtained in this study help to understand this evolutionary mechanism in molecular detail and provide insight regarding its evolutionary impact on genomic architecture and speciation.


Conflict of interest statement

Competing interests. The authors have declared that no competing interests exist.

Figures

Figure 1
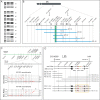
Figure 1. Positional Cloning of not much yang, a Recessive Autosomal sex-ratio Suppressor on the Third Chromosome
(A) A recessive gene on the third chromosome was implicated for uncovering sex-ratio. Through various crossing schemes (see Text S1 for details), chromosomal combinations from sex-ratio (black) and wild-type (white) strains were tested for sex-ratio. In each genotype, bars from left to right represent the X, the second, and the third chromosome, respectively. The bar with a hook represents the Y chromosome. The fourth chromosome was not followed. SR: sex-ratio; WT: wild type (not sex-ratio). (B) A major gene was mapped between P40 and P38 on the right arm of the third chromosome (3R). Shown here are the 2-P lines used in the mapping, with the blue bars representing the D. mauritiana portion of the introgression lines and the gray triangles representing the P[w +] inserts (see Figure S6 for details). The two bent arrows represent the 84F-93F inversion in D. simulans complex as compared to D. melanogaster. Dotted lines represent ASO markers. The target gene (*) falls within the green region that was subsequently mapped in more detail. (C) Fine mapping at 1-kb resolution. Fifty P40 and 40 P38 recombinants were found with their crossovers falling in the CG10841–CG31337 region. The positions of these crossovers were delimited with 13 ASO markers. The sex ratio (proportion of female) for each recombinant is shown here in rank order within each ASO interval. Significant among-recombinant variation in sex ratio is indicated (one-way ANOVA: $, p < 5%; $$, p < 1%, and $$$, p < 0.1%). The target major gene (*) is mapped to the 7-kb interval of CG14369–K44. (D) Two insertions/deletions are responsible for the nmy phenotype. The parental sequences from D. mauritiana w (mau12 Nmy) and D. simulans SSR12-2-7 nmy were amplified by long PCR using the primers k50R30a and k44F30a (arrow heads, see Text S2 for sequences). Empty and filled circles represent a subset of the informative substitutions. The filled rectangles represent the coding sequence of CG14370, which is a single exon gene in D. melanogaster. The sequences between the two filled rectangles, 2,791 bp in mau12 Nmy and 1,427 bp in SSR12-2-7 nmy, are missing in D. melanogaster. The arrow represents the transcription orientation. Dashed lines represent, from left to right, three large deletions of 664, 307, and 388 bp in SSR12-2-7 nmy, respectively. The red arrows stand for inverted repeats (IR) of 380 bp in mau12 Nmy, and a 345-bp homolog in the SSR12-2-7 nmy allele. The green lines represent sequences between the IRs. The last informative 11 recombinants were genotyped with seven ASO probes (nmy135 – nmy7123). Eight of the 11 recombinants (P40.C61 to P38.D29) are shown with their D. mauritiana portions (bars). The three most informative recombinants were sequenced with their crossovers precisely determined. The only difference between P40.B13 Nmy and P40.L12 nmy is the last two insertions/deletions (shaded box).
Figure 2
Figure 2. The Molecular Structure and Evolution of Nmy
(A) An incomplete survey of Nmy/CG14370 alleles found in species of the D. melanogaster subgroup. CG14370 is a single-exon gene in most species, but various inserts are found in D. simulans and D. mauritiana that represent alleles of Nmy. Arrow: transcription orientation; rectangle: transcripts; filled: coding sequence; empty: untranslated region. The status of translation in D. simulans and D. mauritiana is unclear. (B) Comparison of the three Nmy inserts found in D. mauritiana and D. simulans. For each allele, solid lines indicate the genomic sequence with various sequence components marked with symbols (e.g., an empty triangle for a 93-bp element). For Nmy[sim2041] and nmy[sim1427]. Partial transcripts of various lengths are shown as rectangles (filled: coding sequence as in CG14370 but with earlier termination; dotted: alternative transcripts). Black arrow indicates transcription orientation. Two likely alternatively spliced introns (I and II) were identified. Possible spurious reverse-transcription products were also indicated (curved dotted line, see Text S3 for more details). (C) Origin of Nmy inserts by retrotransposition. The cDNA of Dox, Nmy[sim2041], and Nmy[mau2791] are compared and the paralogous regions are highlighted (parallelogram; its twisted form for reverse orientation). The positions of three introns of 57, 63, and 63 bp (vertical broken bar with intron size) and an alternative intron of 91 bp (horizontal green bar) from Dox are shown. Nucleotides at the 5′ ends of the two Nmy alleles and the cDNA of Dox are shown; also shown are the 3′ end of Nmy[sim2041]. Eleven nucleotides, TTGTTTAATTT, near the 3′ end of the Dox transcription were duplicated during the retrotransposition event. The insertion site within CG14370 for the retrotranspostion is also shown. The dinucleotide, TA, before the insertion target (^) was also duplicated, but the nearby tetranucleotides TTGT (underlined) might not be related to the other TTGT (framed). The 3′ end sequences from both Nmy alleles fail to match to the extant cDNA of Dox, but the sequence does match to the genomic regions 114 and 225 bp upstream of Dox, respectively (dotted lines with the number of 114 or 225). The left-hand inverted repeat IR' was most likely generated as a secondary duplication after the retrotransposition event. (D) Both Nmy[sim2041] and Nmy[mau2791] evolved from a common retrotransposed sequence of Dox. Upper: Homologous sequences of 1,467 bp among Dox, Nmy[sim2041], and Nmy[mau2791] were used to construct a star phylogeny with the number of single nucleotide substitutions as well as the three insertions/deletions of 1–3 nucleotides (D3, D3, and D1) mapped on the branches. Lower: Homologous sequences of 345 bp among the two inverted repeats of Nmy[sim2041], Nmy[mau2791], and Dox were used to construct another star phylogeny. The four inverted repeat sequences are essentially identical except for a 6-bp deletion (D6) in IR' of Nmy[sim2041], and two nucleotide substitutions in IR'' of Nmy[mau2791].
Figure 3
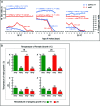
Figure 3. The Expression of sex-ratio Is Temperature Sensitive during Spermatogenesis
(A) The expression of sex-ratio is temperature sensitive. The sex ratio and size of progeny of SSR12-2-7 nmy or simB Nmy (control) males at various ages are shown. “Sperm exhaustion” experiments were done at three temperatures: 18 (± 0.5)°C, room temperature (22 ± 1.0°C), and 25 (± 0.5)°C. Every 3 d, single SSR12-2-7 nmy or simB Nmy males were provided with three w; e virgin females, and the mated w; e females were transferred to fresh vials. The procedure was repeated until the females were no longer fertile. In this fashion, progeny number (mean ± SEM per male) serves as a proxy for the number of functional sperm. The overall sex ratio (k) trend with age (x) is also shown (k = ax + b; n = males tested; p = significance test for the hypothesis a = 0). A significant age effect on sex-ratio was detected at all three temperatures (k = 0.00383x + 0.771; p = 0.046 for SSR12-2-7 nmy at room temperature if the last data point is excluded). The expressivity of sex-ratio is inversely correlated with the temperature. SSR12-2-7 nmy males were as fertile as simB at room tempreature and 25 °C (t-test, p = 0.729 and 0.08, respectively), but they were significantly lower in fertility at 18°C (p = 0.002). (B) The temperature sensitivity of sex-ratio is restricted to spermatogenesis. In this “temperature combination” experiment, pairs of 2-d-old virgin males (SSR12-2-7 nmy or simB Nmy) and females (w; e), reared at either 18 °C or 25 °C, were monitored for copulation up to 8 h at room temperature (22 ± 1 °C). Immediately after copulation, the male was aspirated away while the female was cultured at either 18 °C or 25 °C. These mated females were transferred to fresh vials every 3 d until the females became sterile. Seven to 25 males were tested for each of the 16 combinations of factors (genotype and temperature). The results (sex-ratio ± SEM) are shown as columns, and error bars with the sample sizes are also indicated. A generalized linear model was used for analysis of variance (SAS PROC GENMOD). Only the temperature at which males were reared had a significant effect on the observed sex-ratio (p < 0.0001), while the other two temperatures at which the females and the progeny were reared have no effect (p = 0.5703 and 0.3021, respectively).
Figure 4
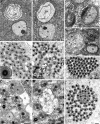
Figure 4. Abnormal Nuclear Transformation of the Y-Bearing Sperm
Ultrastructural studies of sperm nuclear transformation and individualization in wild-type simB Nmy males (A, C, E, G, I) as compared with SSR12-2-7 nmy males (B, D, F, H, J) at 16 °C. All scale bars represent 500 nm. (A and B) Onion stage. The earliest abnormalities are detected as nucleoplasmic vacuoles (*) at the onion stage in the nuclei (N) of nmy (B) but not of Nmy (A) males. The grainy protein body, likely the nucleolus (nu) and the spherical nebenkern (NK), appear to be normal. (C and D) Elongation period. Normally, the nucleoplasm (N) is homogenous, and several rows of microtubules are aligned along the fenestrated portion of the nuclear membrane (arrowheads). A sheath of endoplasmic reticulum (ER) surrounds the nucleus (arrow). In nmy males, some nuclei at this stage have very pronounced nucleoplasmic vacuoles (*), as if the elimination of excess nucleoplasm through the fenestrated side has failed, although the alignment of microtubules is apparently normal (arrowheads, D). On the other hand, some nuclei appear normal, and show a reduced volume compared to the abnormal nuclei (N in D), suggesting some nucleoplasm has already been eliminated. (E and F) Post-elongation period. By the end of this period, the chromatin has been homogeneously condensed and most of the nuclear envelope has been eliminated (E). Meanwhile, arrays of microtubules (arrowheads in lower left insert) have become rigidly organized around the nuclei. However, the nuclear condensation process has been disrupted in many nmy nuclei, in which the nucleoplasmic vacuoles apparently block the condensation progress (* for examples shown in F). Note that nuclear condensation is always accompanied by apposed rows of microtubules (arrowheads in lower left insert of F), lack of which seems to correspond to failed chromatin condensation and the subsequent rupture of nuclear envelope nearby. (G–J) Individualization process. A cystic bulge is initiated at the head region and traverses through the entire length of the spermatid cyst. During this process, excess nucleoplasm, nuclear envelope, and syncytial bridges between spermatids are squeezed away into the waste bag (G). In a cross section through the cystic bulge near the head region, fenestrated (*), and nonfenestrated (#) nuclear envelopes are seen in the process of elimination. One axonemal complex is marked with “v”. For the nuclear head (N in G) that the cystic bulge has already passed, note the absence of surrounding microtubules. (I) In this cross section through the tail region after individualization, 62 spermatid tails are each invested in its own membrane and well separated. One abnormal tail is also seen (arrow). The other three of the 64 tails may have already been eliminated into the waste bag. (H) Nucleoplasmic vacuoles (*) within an abnormal spermatid are squeezed into the tail region, apparently causing physical difficulty for the cystic bulge to pass through. This may explain why individualization cannot proceed through for a cluster of 13 tails (arrow in J), while the other 46 tails appear normal. The other five of the 64 tails were probably eliminated into the waste bag. Also shown in (G) and (H) are some notable structural components within an axonemal complex including basal body (BB), major mitochondrial derivative (MM), minor mitochondrial derivative (mM), and paracrystalline body (PB).
Figure 5
Figure 5. Abnormal Transformation of the Y-Bearing Sperm Detected by DAPI Staining
(A) Onion stage (SSR12-2-7 nmy, 16 °C) similar to that in Figure 4A and 4B. Abnormal nucleoplasmic vacuoles are not visible under the fluorescence microscope. Nucleus (N) and nebenkern (NK) are indicated. Scale bar: 20 μm. (B and C) Spermatids of SSR12-2-7 nmy have strong dimorphism in nuclear transformation at 16 °C (C) as compared with simB Nmy (B). (D and E) The nuclear dimorphism of SSR12-2-7 nmy disappears at 26 °C (E) as compared to simB Nmy (D). Scale bar for B-E: 10 μm.
Figure 6
Figure 6. Temperature-Shift Experiment
At various time points during development from eggs to adults, vials of SSR12-2-7 (nmy) flies were shifted from 18 °C to 25 °C (A) or from 25 °C to 18 °C (B). Seven to 32 males eclosed from each of these vials were tested for sex-ratio, and the results (sex ratio and error bar = SEM) are shown at the time points of temperature shift. The stages of spermatogenesis at critical points (A–L) were examined cytologically (see Figure 7 for the corresponding images).
Figure 7
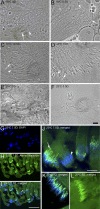
Figure 7. Critical Stage for Temperature Sensitivity
Five spermatid bundles of the most advanced stage from each of the five gonads or testes were examined at each critical point of the temperature shift experiment under phase contrast optics (A–F) or epifluorescence (G–L). Spermatid development stages (p to s) were classified according to the standard described in [41]. Scale bar: 10 μm (A–F); 100 μm (G–I); 20 μm (J–L). (A–D) Spermatogenesis at 18 °C before the early middle stage of elongation (stages p or q) can be rescued for sex-ratio by shifting to 25 °C (A; also see Figure 6). However, when spermatogenesis reaches late middle stage of elongation (stage r), the rescue is almost impossible (B–D). Thus, stage r is the late boundary of temperature sensitivity. Note the phase dark nucleoplasmic vacuoles in the abnormal nuclei (arrow) as compared to normal nuclear transformation (arrowhead). (E and F) Spermatogenesis at 25 °C up to the middle stage of elongation (stages q and r) can be affected by 18 °C treatment to give full sex-ratio (E). However, the temperature sensitivity decreases once the spermatogenesis reaches the fully elongated stage (stage s) (F). (G–L) Individualization complex (IC) is viewed with Alexa Fluor 488 Phalloidin that binds to F-actin (green) while the nuclei are marked by DAPI (blue). By the beginning of individualization (arrow in I and J, where J is a closeup of I; compared to a younger bundle in which the IC has not formed yet, arrowhead), the 18 °C treatment can only cause a slight sex ratio distortion (Figure 6B). On the 8th day of spermatogenesis at 25 °C, there are numerous spermatid bundles that have initiated individualization (K) or that have the IC traversing along the tails (L). The 18 °C treatment has no effect from this time on.

Comment in

References

    1. Fisher RA. The genetical theory of natural selection. A complete variorium edition. Oxford: Oxford University Press; 1930. 318
    1. Edwards AWF (2000) Carl Düsing. on The Regulation of the Sex-Ratio . Theor Pop Biol. 1884;58:255–257. - PubMed
    1. Shaw RF, Mohler JD. The selective significance of the sex ratio. Am Nat. 1953;87:337–342.
    1. Hamilton WD. Extraordinary sex ratios. Science. 1967;156:477–488. - PubMed
    1. Bull JJ, Charnov EL. How fundamental are Fisherian sex ratios? In: Harvey PH, Partridge L, editors. Oxford surveys in evolutionary biology. New York: Oxford University Press; 1988. pp. 97–135.

Publication types