. 2008 Mar;53(5):731-8.
doi: 10.1111/j.1365-313X.2007.03363.x. Epub 2007 Nov 6.

MicroRNA399 is a long-distance signal for the regulation of plant phosphate homeostasis

Affiliations

MicroRNA399 is a long-distance signal for the regulation of plant phosphate homeostasis

Bikram Datt Pant et al. Plant J. 2008 Mar.

Abstract

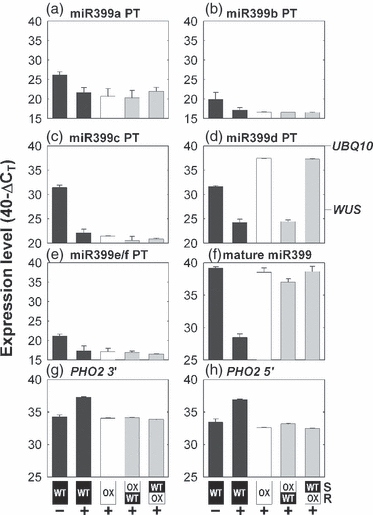
The presence of microRNA species in plant phloem sap suggests potential signaling roles by long-distance regulation of gene expression. Proof for such a role for a phloem-mobile microRNA is lacking. Here we show that phosphate (Pi) starvation-induced microRNA399 (miR399) is present in the phloem sap of two diverse plant species, rapeseed and pumpkin, and levels are strongly and specifically increased in phloem sap during Pi deprivation. By performing micro-grafting experiments using Arabidopsis, we further show that chimeric plants constitutively over-expressing miR399 in the shoot accumulate mature miR399 species to very high levels in their wild-type roots, while corresponding primary transcripts are virtually absent in roots, demonstrating shoot-to-root transport. The chimeric plants exhibit (i) down-regulation of the miR399 target transcript (PHO2), which encodes a critical component for maintenance of Pi homeostasis, in the wild-type root, and (ii) Pi accumulation in the shoot, which is the phenotype of pho2 mutants, miR399 over-expressers or chimeric plants with a genetic knock-out of PHO2 in the root. Hence the transported miR399 molecules retain biological activity. This is a demonstration of systemic control of a biological process, i.e. maintenance of plant Pi homeostasis, by a phloem-mobile microRNA.


Figures

Figure 1
Figure 1
Mature miR399 levels in phloem sap change with phosphate status. (a) Levels of mature miR399 in phloem saps of Brassica napus and Curcurbita maxima grown under full nutrient (FN, black bars) and Pi-limited (white bars) conditions. Data (mean ± SE, n = 3) depict 40 − CT values, i.e. the cycle number when PCR ends (the threshold cycle number of the amplicon). Note the logarithmic scale (log(1 + E), where E is the PCR efficiency) of the y axis. miR399 cDNA produced from 10 ng total RNA was included in each assay. (b) Pi levels in leaves of FN-grown and Pi-limited Brassica napus and Curcurbita maxima plants. Data are the mean±SE (n = 4 or 5). (c, d) Levels of mature miR399 and mature miR164 in phloem sap, roots, leaves and stems of Brassica napus grown under full nutrient (black bars) and Pi-limited (white bars) conditions, as determined by quantitative real-time PCR. Data are depicted as in (a). miR399 or miR164 cDNA produced from 20 ng total RNA was included in each assay. Data are the mean ± standard deviation of two biological replicates (with two technical replicates for each), each pooled from 4–10 plants in independent experiments. (e–g) RNA gel blot signals for miR399 (e, g) and miR172 (f) in phloem-sap of Brassica napus plants grown with 0.5 mm (+) or without (−) phosphate (e,f) or sulfate (g). An aliquot (10 μg) of total RNA isolated from pooled samples (n = 4–10) was loaded in each lane. 5.8S rRNA is shown as a loading control.
Figure 2
Figure 2
Quantitative real-time PCR expression levels of miR399 and PHO2 in shoots. Levels of (a–e) the five miR399 primary transcripts (PT), (f) mature miR399, and (g, h) PHO2 in shoots of WT (black bars), miR399 OX (white bars), and micrografted chimeric plants (gray bars). Shoot (S) and root (R) genotypes of the chimeric plants are depicted below the graphs. Plants were grown with Pi (+) or were Pi-starved (−). Expression levels are given on a logarithmic scale expressed as 40 – ΔCT, where ΔCT is the difference in quantitative real-time PCR threshold cycle number (CT value) between the studied gene and the reference gene UBQ10 (At4g05320); 40 therefore equals the expression level of UBQ10 (the number 40 was chosen because the PCR run stops after 40 cycles). The fold difference in expression is 2ΔΔCT when the PCR efficiency is 2 (e.g. an ordinate value of 30 represents 1000-fold lower expression than a value of 40). The results are the mean ± standard deviation for two biological replicates each pooled from four or five shoots in independent experiments.
Figure 3
Figure 3
Quantitative real-time PCR expression levels of miR399 and PHO2 in roots. Levels of (a–e) the five miR399 primary transcripts (PT), (f) mature miR399, and (g,h) PHO2 in shoots of WT (black bars), miR399 OX (white bars), and micrografted chimeric plants (gray bars). Shoot (S) and root (R) genotypes of the chimeric plants are depicted below the graphs. Plants were grown with Pi (+) or were Pi-starved (−). Expression levels are given as described in the legend to Figure 2. The results in (a–e), (g) and (h) are the mean ± standard deviation of two biological replicates pooled from 3–6 seedling roots in independent experiments, and the results in (f) are the mean ± standard deviation of three biological replicates pooled from 2–6 roots in independent experiments. Two technical replicates were measured for each biological replicate.
Figure 4
Figure 4
Leaf phosphate levels in chimeric plants. Phosphate levels in leaves of 5-week-old, hydroponically grown WT (black bars), miR399 OX (white bars), pho2 mutant (gray bars) and reciprocally grafted chimeras (hatched bars). Shoot (S) and root (R) genotypes of the chimeric plants are depicted below the graph. Data are mean values ± SE (n = 4 or 5).
Figure 5
Figure 5
Absence of miR399d precursor fragments in roots of OX/WT chimeras. (a) Depiction of miR399d primary transcript structure. miR399 is shown in black, the miR399 precursor in gray, and the residual parts of the known transcript in white. The hatched part towards the 3′ end is of unknown size. RT1 is the oligo(dT) primer, RT2 is the reverse transcription primer used for cDNA synthesis for the quantitative real-time PCR measurements shown in (b) and (c), together with quantitative real-time PCR primers Fwd and Rev. (b, c) Expression levels of the quantitative real-time PCR amplicon in (b) shoots and (c) roots. For additional information, see legends to Figures 2 and 3.

References

    1. Allen E, Xie Z, Gustafson AM, Carrington JC. MicroRNA-directed phasing during trans-acting siRNA biogenesis in plants. Cell. 2005;121:207–221. - PubMed
    1. Aung K, Lin SI, Wu CC, Huang YT, Su CL, Chiou TJ. Pho2, a phosphate overaccumulator, is caused by a nonsense mutation in a microRNA399 target gene. Plant Physiol. 2006;141:1000–1011. - PMC - PubMed
    1. Bari R, Pant BD, Stitt M, Scheible W-R. PHO2, microRNA399, and PHR1 define a phosphate-signaling pathway in plants. Plant Physiol. 2006;141:988–999. - PMC - PubMed
    1. Bariola PA, Howard CJ, Taylor CB, Verburg MT, Jaglan VD, Green PJ. The Arabidopsis ribonuclease gene RNS1 is tightly controlled in response to phosphate limitation. Plant J. 1994;6:673–685. - PubMed
    1. Bates R, Lynch JP. Root hairs confer a competitive advantage under low phosphate availability. Plant Soil. 2001;236:243–250.

Publication types