. 2007 Nov 7:7:124.
doi: 10.1186/1471-213X-7-124.

Dermal fibroblasts derived from fetal and postnatal humans exhibit distinct responses to insulin like growth factors

Affiliations

Dermal fibroblasts derived from fetal and postnatal humans exhibit distinct responses to insulin like growth factors

Kerstin J Rolfe et al. BMC Dev Biol. .

Abstract

Background: It has been well established that human fetuses will heal cutaneous wounds with perfect regeneration. Insulin-like growth factors are pro-fibrotic fibroblast mitogens that have important roles in both adult wound healing and during development, although their relative contribution towards fetal wound healing is currently unknown. We have compared responses to IGF-I and -II in human dermal fibroblast strains derived from early gestational age fetal (<14 weeks) and developmentally mature postnatal skin to identify any differences that might relate to their respective wound healing responses of regeneration or fibrosis.

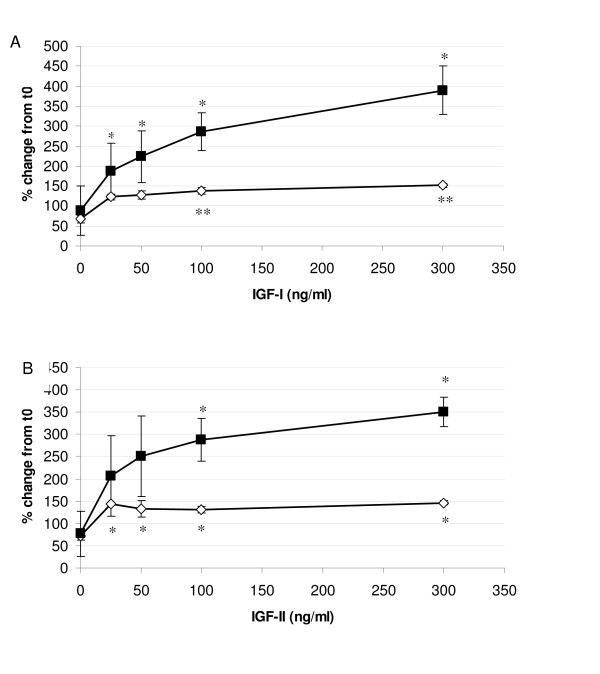
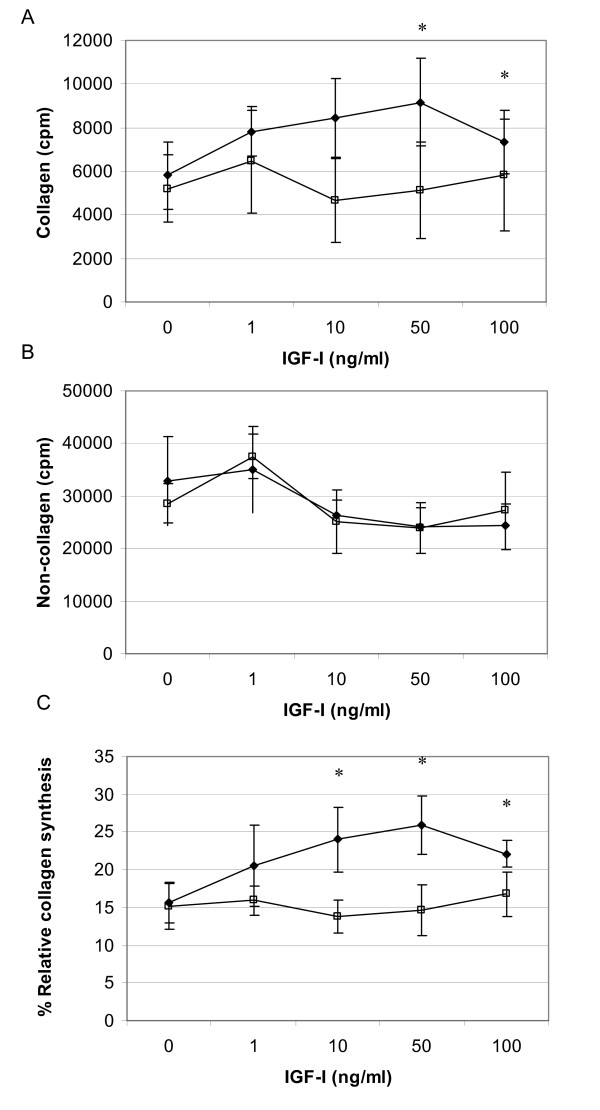
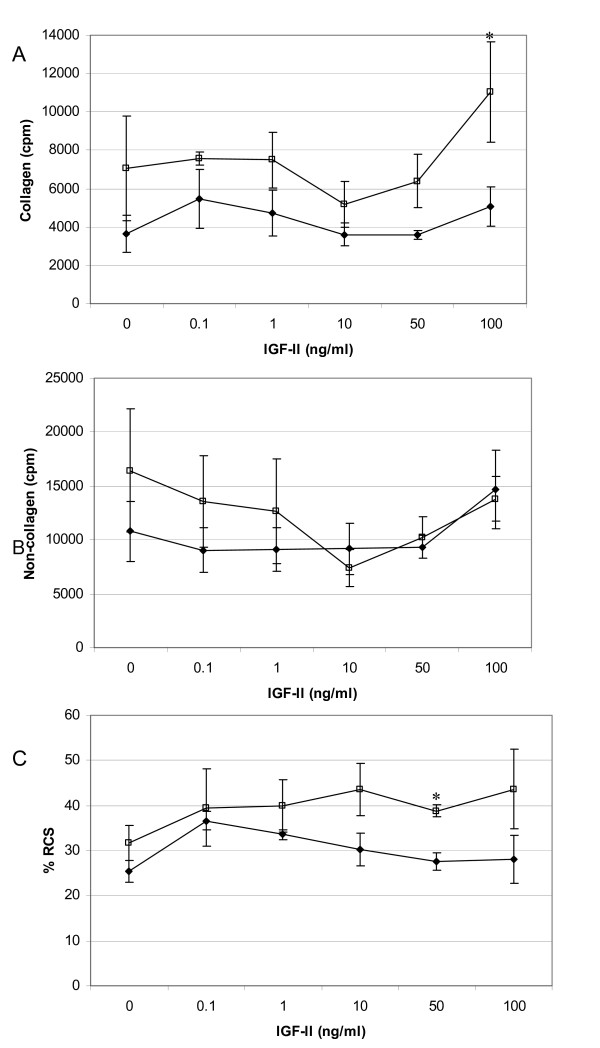
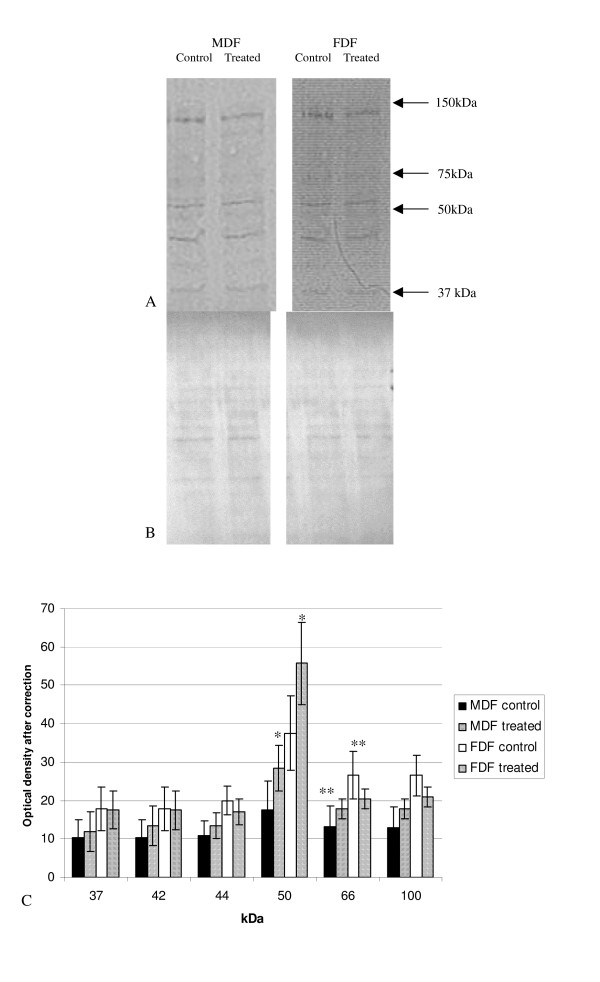
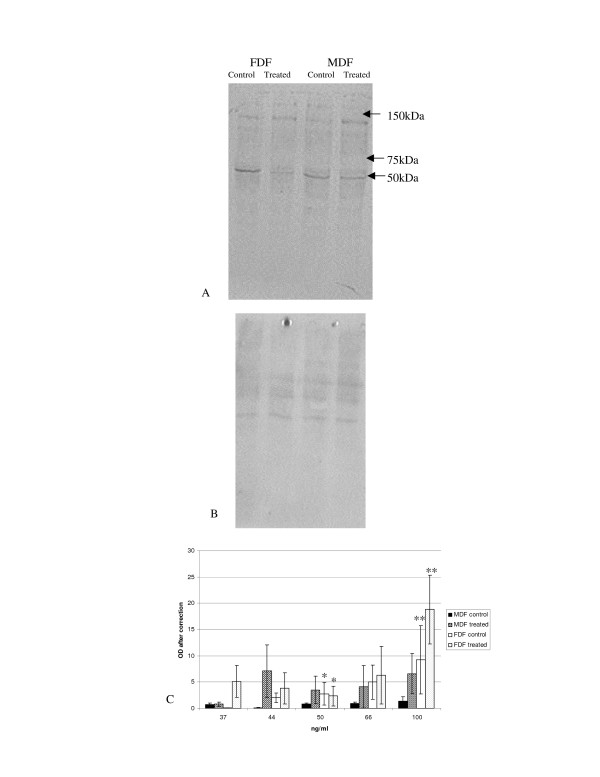
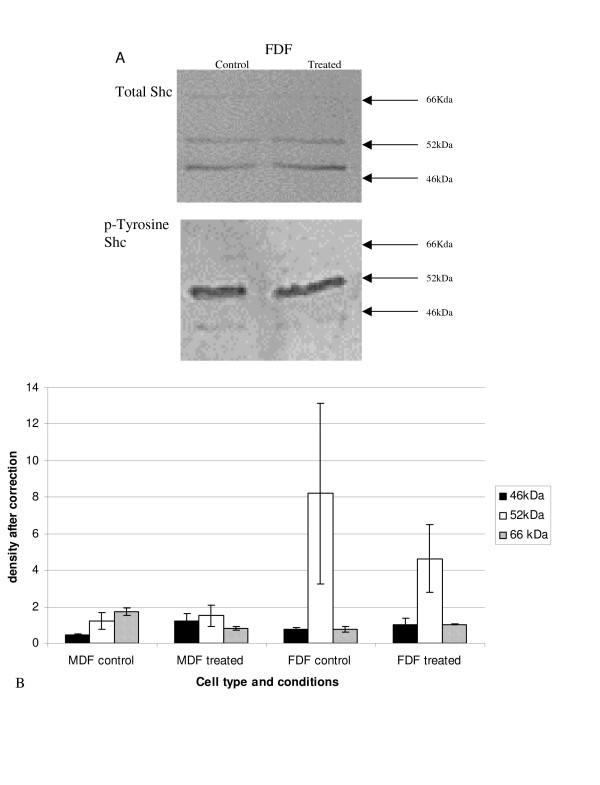
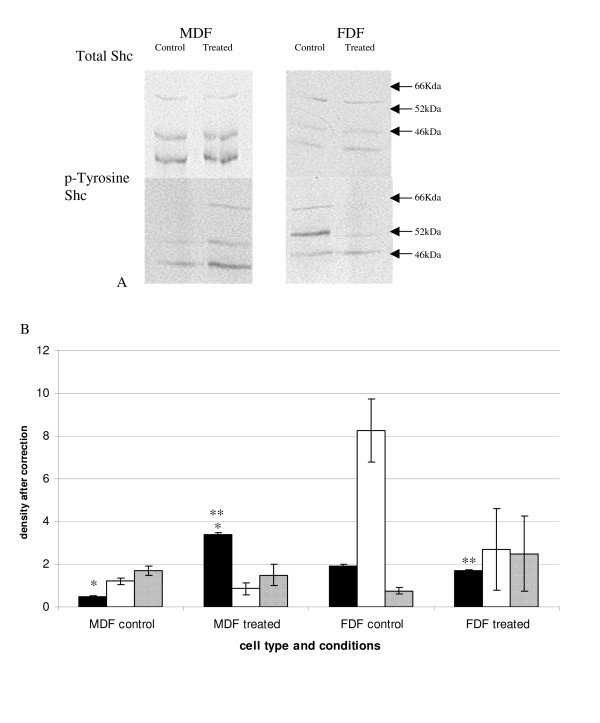
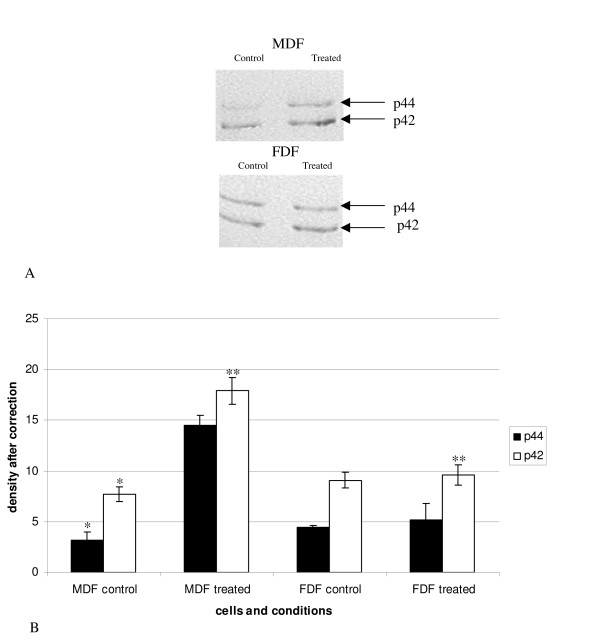
Results: We have established that the mitogenic response of fetal cells to both IGF-I and -II is much lower than that seen in postnatal dermal fibroblasts. Further, unlike postnatal cells, fetal cells fail to synthesise collagen in response to IGF-I, whereas they do increase synthesis in response to IGF-II. This apparent developmentally regulated difference in response to these related growth factors is also reflected in changes in the tyrosine phosphorylation pattern of a number of proteins. Postnatal cells exhibit a significant increase in phosphorylation of ERK 1 (p44) in response to IGF-I and conversely the p46 isoform of Shc on IGF-II stimulation. Fetal cells however only show a significant increase in an unidentified 100 kDa tyrosine-phosphorylated protein on stimulation with IGF-II.

Conclusion: Dermal fibroblasts exhibit different responses to the two forms of IGF depending on their developmental maturity. This may relate to the developmental transition in cutaneous wound healing from regeneration to fibrosis.


Figures

Figure 1
Figure 1
Proliferation response of dermal fibroblasts to IGF-I and IGF-II. A: The mean proliferation curve in response to IGF-I at 72 hrs for both FDF (open squares; n = 3) and MDF (closed diamonds; n = 3) in 0.4% FCS-containing medium. Error bars = SEM. (*p = < 0.05; **p = < 0.005). FDF only showed statistical difference at 100 and 300 ng/ml. MDF showed a statistical increase in proliferation at 25 ng/ml, 50 ng/ml, 100 ng/ml and 300 ng/ml compared to untreated controls. B: The mean proliferation curve in response to IGF-II at 72 h for both FDF (open squares; n = 3) and MDF (closed diamonds; n = 3) in 0.4% FCS-containing medium. Error bars = SEM. (*p = < 0.05). FDF showed a statistical increase throughout the concentration range compared to untreated controls. MDF showed a statistical significance from the untreated control at 100 and 300 ng/ml.
Figure 2
Figure 2
Collagen production in response to IGF-I. Radio-labelled proline uptake assay demonstrating modulation of protein synthesis by IGF-I. Panel A and B depict IGF-I elicited changes in collagen and non-collagen synthesis respectively, by FDF (n = 3, open squares) and MDF (n = 3, closed diamonds). All data is represented as cpm/105 cells (mean ± sem). Panel C illustrates changes in relative collagen synthesis between MDF and FDF in response to IGF-I; data represented as % (mean ± sem). * p = < 0.05. MDF cell strains demonstrated significantly higher collagen synthesis than untreated controls at 50 and 100 ng/ml of IGF-I (*p = 0.034 and 0.047 respectively); and significantly higher %RCS than untreated controls at 10, 50 and 100 ng/ml of IGF-I (*p = 0.047, 0.021 and 0.028 respectively). In contrast FDF cell strains showed no significant effect of IGF-I treatment on either collagen or protein synthesis over the entire titration range.
Figure 3
Figure 3
Collagen production in response to IGF-II. Radio-labelled proline uptake assay demonstrating modulation of protein synthesis by IGF-II. Panel A and B depict IGF-II elicited changes in collagen and non-collagen synthesis respectively, by FDF (n = 3, open squares) and MDF (n = 3, closed diamonds). All data is represented as cpm/105 cells (mean ± sem). Panel C illustrates changes in relative collagen synthesis between MDF and FDF in response to IGF-II; data represented as % (mean ± sem). * p = < 0.05. Collagen synthesis was significantly higher for FDF over untreated control at 100 ng/ml IGF-II. There was no significant change in non-collagen synthesis for either cell type. Student t-tests demonstrated that the %RCS produced by FDF with 50 ng/ml IGF-II was significantly higher than that produced by PDF (*p = 0.016). ANOVA analysis showed that both collagen count data and % RCS data from FDF are highly significantly different (p = 0.003 and 0.010 respectively) from PDF cell strain data.
Figure 4
Figure 4
IGF-IR in dermal fibroblasts. A: Protein lysates from quiescent cells were analysed by Western blot using a specific antibody against IGF-IR. B: To ensure equal loading β-actin was also used. C: The graph represents the change in IGF-IR between MDF and FDF cell strains (n = 3 for each). Error bars = SEM. No statistical significant difference was demonstrated between the cell types.
Figure 5
Figure 5
Tyrosine phosphorylated proteins after stimulation with IGF-I. A: Protein lysates from cells treated with IGF-I for 20 mins were analysed by Western blot using a specific antibody against tyrosine phosphorylated proteins. B: To ensure equal loading used the MemCode Reversible™ protein stain (Pierce Biotechnology). C: The graph represents the change in tyrosine phosphorylation after ensuring for equal loading. The graph represents the results for FDF (n = 5; closed bar un-stimulated, diamonds represents stimulated cells) and MDF (n = 5 hash bar represents un-stimulated and the closed bar stimulated). Error bars = SEM. A statistical increase was shown in FDF following stimulation with IGF-I compared to MDF at 50 kDa (*p = 0.028); a further statistical difference was shown with an increase of a band at 66 kDa in unstimulated FDF cells compared to unstimulated MDF (**p = 0.024). Two way ANOVA showed a statistical significant (p = 0.007) difference in the mean values among the different cell type greater than would be expected by chance allowing for the difference in treatment.
Figure 6
Figure 6
Tyrosine phosphorylated proteins after stimulation with IGF-II. A: Representative Western blot. Protein lysates from cells treated with IGF-II for 20 mins were analysed by Western blot using a specific antibody against tyrosine phosphorylated proteins. B: To ensure equal loading used the MemCode Reversible™ protein stain (Pierce Biotechnology) C: The graph represents the mean change in tyrosine phosphorylation after ensuring for equal loading following stimulation with IGF-II for FDF (n = 5 open bar un-stimulated; lined bar represents stimulated lysates) and MDF (n = 5 closed bar represents un-stimulated lysates; thick lines represents stimulated lysates). Error bars = SEM. A statistical decrease in FDF (p = 0.048) was identified for a band at 50 kDa following stimulation with IGF-II. FDF showed a statistical increase when comparing un-stimulated cells with stimulated cells at 100 kDa (p = 0.029) and a further statistical increase was demonstrated between FDF and MDF when cells had been stimulated with IGF-II at for a band at 100 kDa (p = 0.049).
Figure 7
Figure 7
Tyrosine phosphorylated Shc after stimulation with IGF-I. A: Protein lysates from cells treated with IGF-I for 20 mins were analysed by Western blot. A: Shows a representative western blot analysis for total Shc. Protein lysates were immunoprecipiated with an anti-Shc antibody as described in the materials and methods and the precipitate was run on a western blot and stained with the antibody p-Tyr and a representative western is shown in B. B: A graph representing the densitometry, after correcting for total-Shc. Bars show average for n = 5 FDF and n = 5 MDF and SEM (closed bar 46 kDa, open bar 52 kDa, and hashed bar 66 kDa). No statistical difference was demonstrated for any group.
Figure 8
Figure 8
Tyrosine phosphorylated Shc after stimulation with IGF-II. Protein lysates from cells treated with IGF-II for 20 mins were analysed by Western blot. A: Shows a representative western blot analysis for total Shc. Protein lysates were immunoprecipiated with an anti-Shc antibody as described in the materials and methods and the precipitate was run on a Western blot and stained with the antibody p-Tyr and a representative Western blot is shown in A. B: shows the graph plotting the densometry, after correcting for total Shc. A statistical significant difference was demonstrated for p46 with MDF showing a significant increase after treatment (*p = 0.03) and the MDF treated group was statistically greater than the FDF treated group (**p = 0.004). n = 5 FDF and n = 5 MDF (closed bar 46 kDa, open bar 52 kDa, and hashed bar 66 kDa). Error bars = SEM.
Figure 9
Figure 9
Phosphorylated MAPK in response to IGF-I. Protein lysates from cells treated with exogenous IGF-I were analysed by Western blot analysis using a specific anti MAPK (Promega). A: shows a representative Western blot. B: shows a graph representing n = FDF, n = MDF with error bars SEM. A statistical significant increase was demonstrated for p44 in the MDF control (untreated group) and the MDF treated group (*p = 0.04). A trend towards a significant increase was also demonstrated between MDF control and MDF treated for p42 (p = 0.07). FDF showed no significant increase. A statistical significant difference was identified between stimulated FDF and stimulated MDF for p42.

Similar articles

Cited by

References

    1. Rowlatt U. Intrauterine wound healing in a 20-week human fetus. Virchows Arch A Pathol Anat Histol. 1979;381:353–61. doi: 10.1007/BF00432477. - DOI - PubMed
    1. Ferguson MW, Whitby DJ, Shah M, Armstrong J, Siebert JW, Longaker MT. Scar formation: the spectral nature of fetal and adult wound repair. Plast Reconstr Surg. 1996;97:854–60. doi: 10.1097/00006534-199604000-00029. - DOI - PubMed
    1. Lorenz HP, Whitby DJ, Longaker MT, Adzick NS. Fetal wound healing: The ontogeny of scar formation in the non-human primate. Ann Surg. 1993;217:391–6. doi: 10.1097/00000658-199304000-00011. - DOI - PMC - PubMed
    1. Jones JI, Clemmons DR. Insulin-like growth factors and their binding proteins: biological actions. Endocr Rev. 1995;16:3–34. doi: 10.1210/er.16.1.3. - DOI - PubMed
    1. Gartner MH, Benson JD, Caldwell MD. Insulin-like growth factors I and II expression in the healing wound. J Surg Res. 1992;52:389–94. doi: 10.1016/0022-4804(92)90121-F. - DOI - PubMed

MeSH terms

Substances