

Gene expression atlas of the mouse central nervous system: impact and interactions of age, energy intake and gender
- PMID: 17988385
- PMCID: PMC2258177
- DOI: 10.1186/gb-2007-8-11-r234
Gene expression atlas of the mouse central nervous system: impact and interactions of age, energy intake and gender
Abstract
Background: The structural and functional complexity of the mammalian central nervous system (CNS) is organized and modified by complicated molecular signaling processes that are poorly understood.
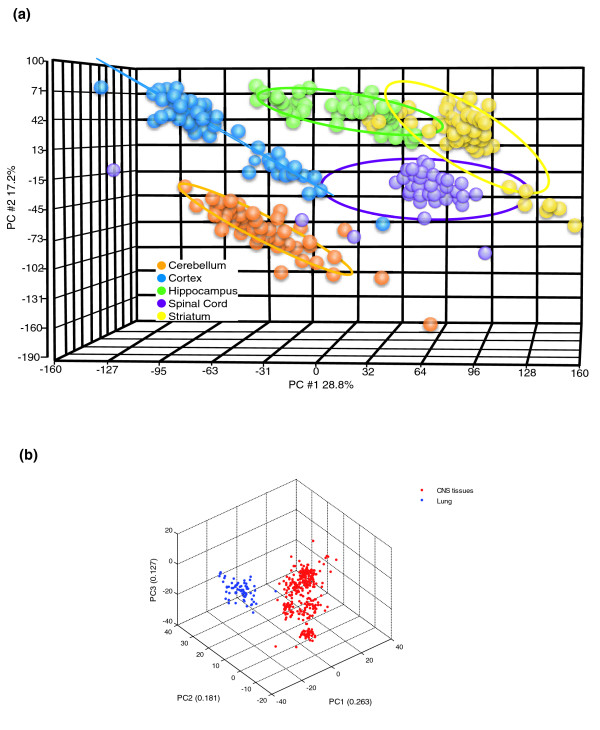
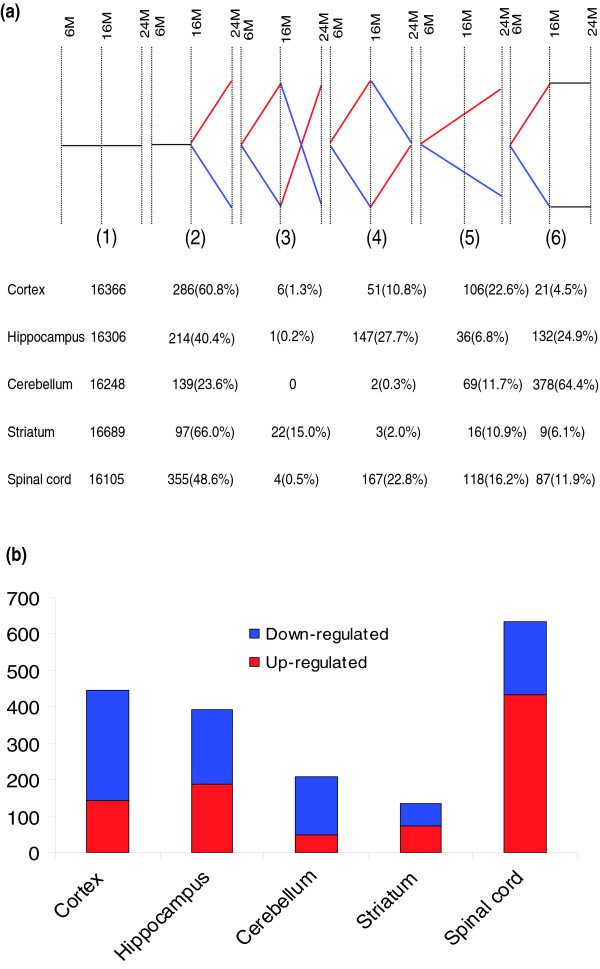
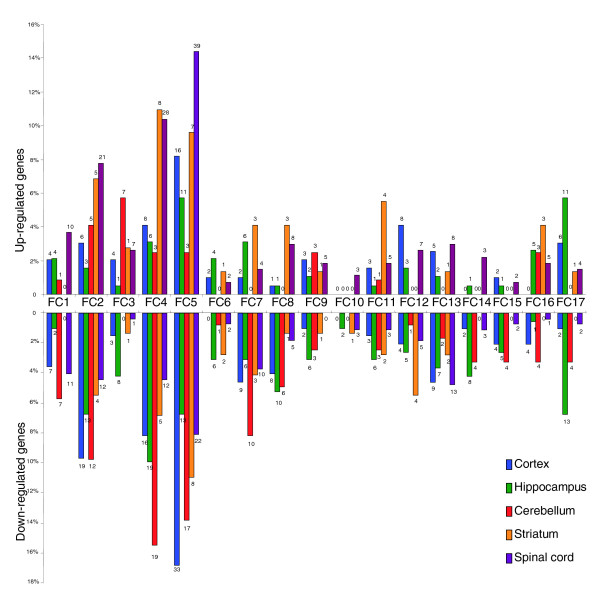
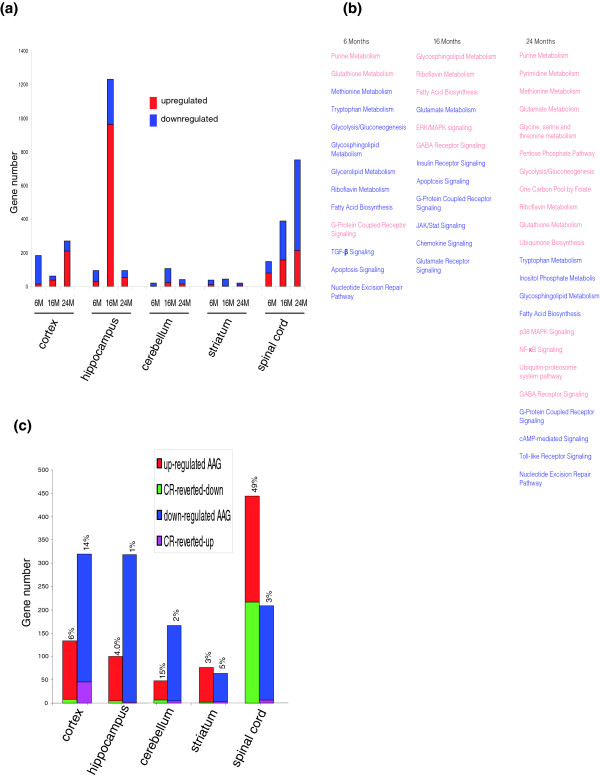
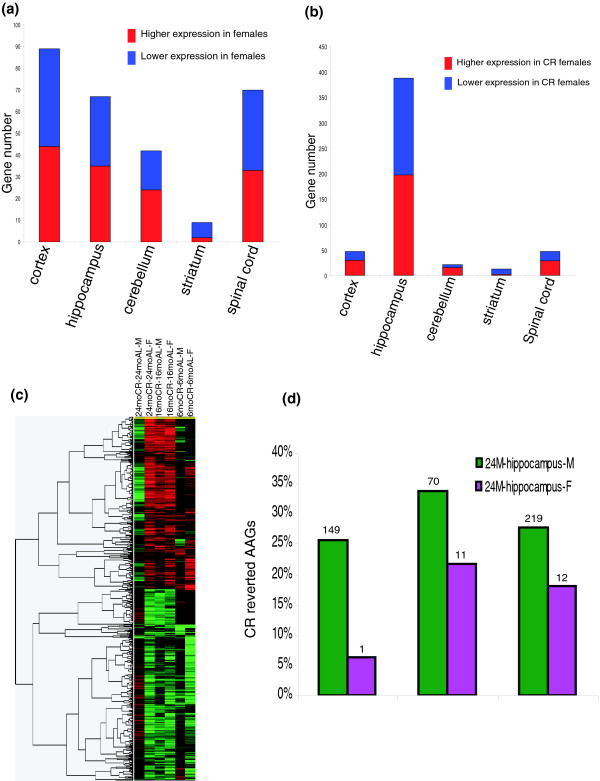
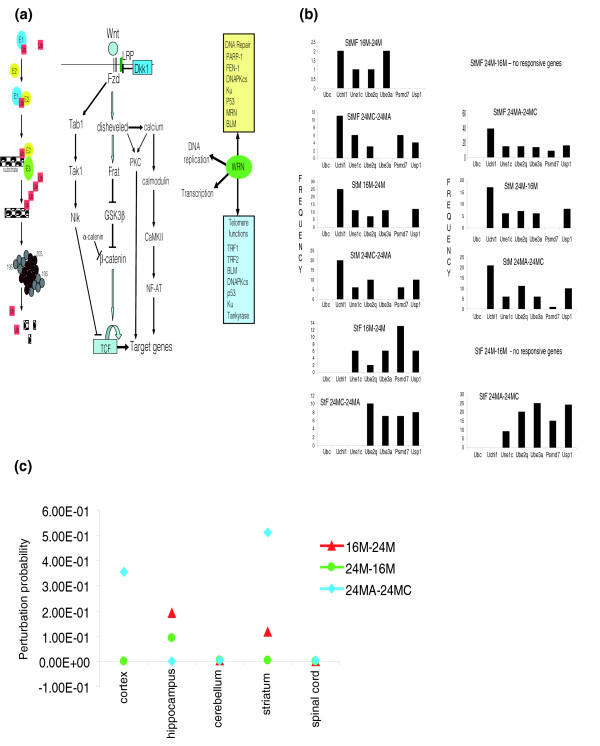
Results: We measured transcripts of 16,896 genes in 5 CNS regions from cohorts of young, middle-aged and old male and female mice that had been maintained on either a control diet or a low energy diet known to retard aging. Each CNS region (cerebral cortex, hippocampus, striatum, cerebellum and spinal cord) possessed its own unique transcriptome fingerprint that was independent of age, gender and energy intake. Less than 10% of genes were significantly affected by age, diet or gender, with most of these changes occurring between middle and old age. The transcriptome of the spinal cord was the most responsive to age, diet and gender, while the striatal transcriptome was the least responsive. Gender and energy restriction had particularly robust influences on the hippocampal transcriptome of middle-aged mice. Prominent functional groups of age- and energy-sensitive genes were those encoding proteins involved in DNA damage responses (Werner and telomere-associated proteins), mitochondrial and proteasome functions, cell fate determination (Wnt and Notch signaling) and synaptic vesicle trafficking.
Conclusion: Mouse CNS transcriptomes responded to age, energy intake and gender in a regionally distinctive manner. The systematic transcriptome dataset also provides a window into mechanisms of age-, diet- and sex-related CNS plasticity and vulnerability.
Figures
Similar articles
-
Conserved and differential effects of dietary energy intake on the hippocampal transcriptomes of females and males.PLoS One. 2008 Jun 11;3(6):e2398. doi: 10.1371/journal.pone.0002398. PLoS One. 2008. PMID: 18545695 Free PMC article.
-
Transcriptome analysis provides genome annotation and expression profiles in the central nervous system of Lymnaea stagnalis at different ages.BMC Genomics. 2021 Sep 3;22(1):637. doi: 10.1186/s12864-021-07946-y. BMC Genomics. 2021. PMID: 34479505 Free PMC article.
-
Expression of DA11, a neuronal-injury-induced fatty acid binding protein, coincides with axon growth and neuronal differentiation during central nervous system development.J Neurosci Res. 1997 Jun 15;48(6):551-62. doi: 10.1002/(sici)1097-4547(19970615)48:6<551::aid-jnr8>3.0.co;2-9. J Neurosci Res. 1997. PMID: 9210525
-
Building an RNA Sequencing Transcriptome of the Central Nervous System.Neuroscientist. 2016 Dec;22(6):579-592. doi: 10.1177/1073858415610541. Epub 2015 Oct 13. Neuroscientist. 2016. PMID: 26463470 Free PMC article. Review.
-
Role of Wnt Signaling in Central Nervous System Injury.Mol Neurobiol. 2016 May;53(4):2297-311. doi: 10.1007/s12035-015-9138-x. Epub 2015 May 15. Mol Neurobiol. 2016. PMID: 25976365 Review.
Cited by
-
DNA methylation and cognitive aging.Oncotarget. 2015 Jun 10;6(16):13922-32. doi: 10.18632/oncotarget.4215. Oncotarget. 2015. PMID: 26015403 Free PMC article. Review.
-
DNA Methyltransferase 1 (DNMT1) Function Is Implicated in the Age-Related Loss of Cortical Interneurons.Front Cell Dev Biol. 2020 Jul 22;8:639. doi: 10.3389/fcell.2020.00639. eCollection 2020. Front Cell Dev Biol. 2020. PMID: 32793592 Free PMC article.
-
Conserved and differential effects of dietary energy intake on the hippocampal transcriptomes of females and males.PLoS One. 2008 Jun 11;3(6):e2398. doi: 10.1371/journal.pone.0002398. PLoS One. 2008. PMID: 18545695 Free PMC article.
-
Intermittent metabolic switching, neuroplasticity and brain health.Nat Rev Neurosci. 2018 Feb;19(2):63-80. doi: 10.1038/nrn.2017.156. Epub 2018 Jan 11. Nat Rev Neurosci. 2018. PMID: 29321682 Free PMC article. Review.
-
Multi-omics analysis reveals neuroinflammation, activated glial signaling, and dysregulated synaptic signaling and metabolism in the hippocampus of aged mice.Front Aging Neurosci. 2022 Nov 3;14:964429. doi: 10.3389/fnagi.2022.964429. eCollection 2022. Front Aging Neurosci. 2022. PMID: 36408109 Free PMC article.
References
-
- Okami P, Shackelford TK. Human sex differences in sexual psychology and behavior. Annu Rev Sex Res. 2001;12:186–241. - PubMed
-
- Woods SC, Gotoh K, Clegg DJ. Gender differences in the control of energy homeostasis. Exp Biol Med. 2003;228:1175–1180. - PubMed
-
- Behl C. Oestrogen as a neuroprotective hormone. Nat Rev Neurosci. 2002;3:433–442. - PubMed
Publication types
MeSH terms
Substances
Grants and funding
LinkOut - more resources
Full Text Sources
Molecular Biology Databases
