. 2007 Nov 7:7:213.
doi: 10.1186/1471-2148-7-213.

The limits of subfunctionalization

Affiliations

The limits of subfunctionalization

Thomas MacCarthy et al. BMC Evol Biol. .

Abstract

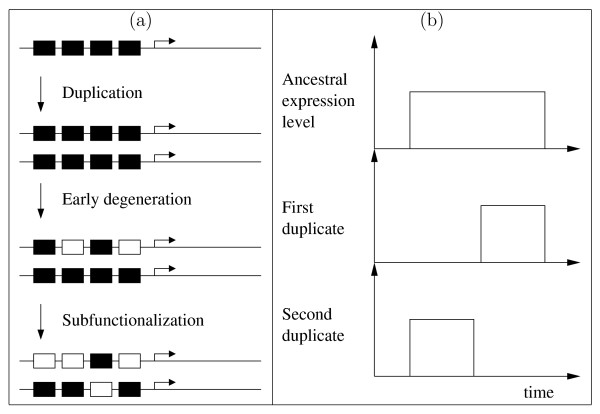
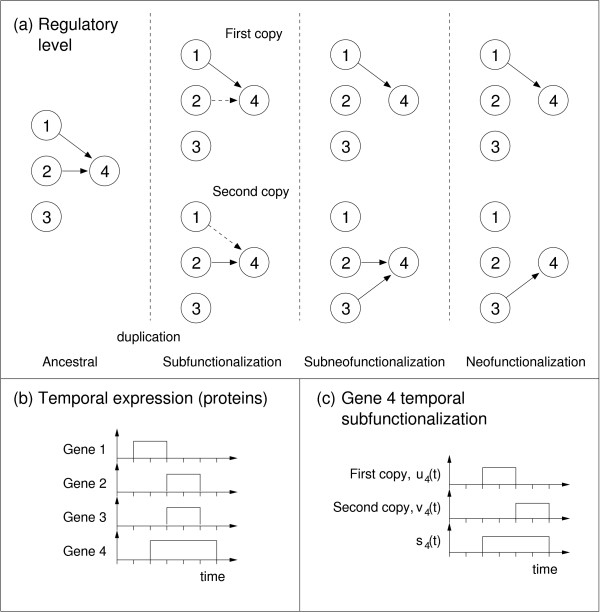
Background: The duplication-degeneration-complementation (DDC) model has been proposed as an explanation for the unexpectedly high retention of duplicate genes. The hypothesis proposes that, following gene duplication, the two gene copies degenerate to perform complementary functions that jointly match that of the single ancestral gene, a process also known as subfunctionalization. We distinguish between subfunctionalization at the regulatory level and at the product level (e.g within temporal or spatial expression domains).

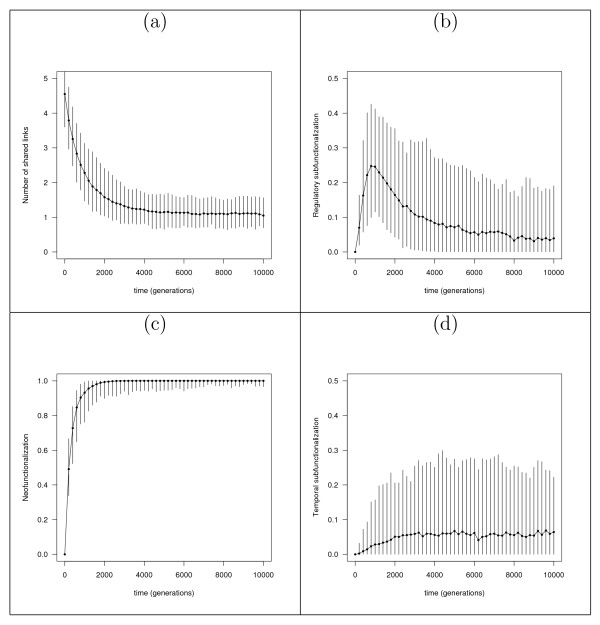
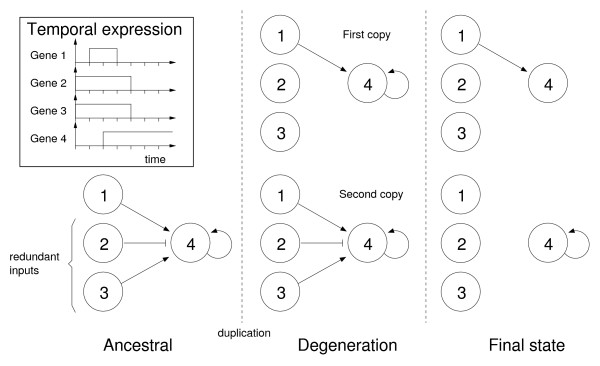
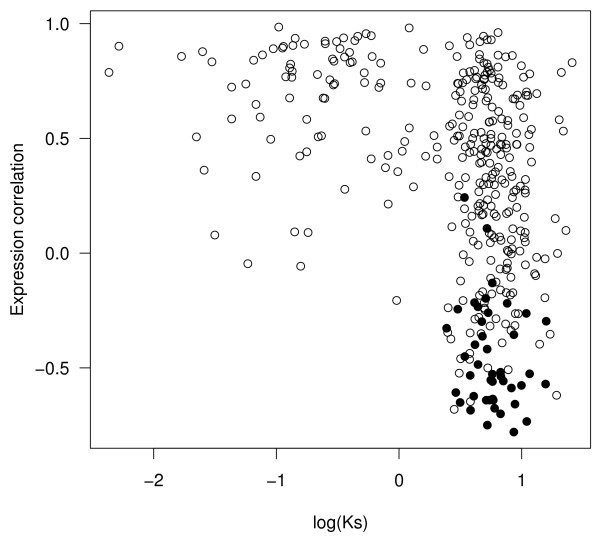
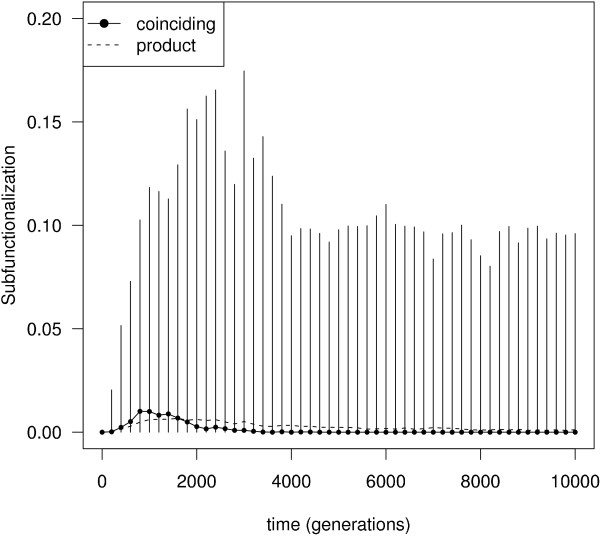
Results: In contrast to what is expected under the DDC model, we use in silico modeling to show that regulatory subfunctionalization is expected to peak and then decrease significantly. At the same time, neofunctionalization (recruitment of novel interactions) increases monotonically, eventually affecting the regulatory elements of the majority of genes. Furthermore, since this process occurs under conditions of stabilizing selection, there is no need to invoke positive selection. At the product level, the frequency of subfunctionalization is no higher than would be expected by chance, a finding that was corroborated using yeast microarray time-course data. We also find that product subfunctionalization is not necessarily caused by regulatory subfunctionalization.

Conclusion: Our results suggest a more complex picture of post-duplication evolution in which subfunctionalization plays only a partial role in conjunction with redundancy and neofunctionalization. We argue that this behavior is a consequence of the high evolutionary plasticity in gene networks.


Figures

Figure 1
Figure 1
The duplication-degeneration-complementation (DDC) model. (a) A gene with four regulatory elements (black boxes), each controlling independent functions such as expression domains, is duplicated. Random null mutations in the regulatory elements (open boxes) through degeneration lead to subfunctionalization, where the regulatory elements complement each other to achieve the full ancestral repertoire. (b) Temporal subfunctionalization, illustrated here by the temporal expression patterns of a hypothetical ancestor and two evolved duplicates. The expression level of the duplicates has evolved such that the ancestral expression pattern is maintained in complementary temporal domains via the combined expression of the two duplicates.
Figure 2
Figure 2
A simple example of network evolution. (a) At the regulatory level, gene 4 receives inputs from genes 1 and 2 in the ancestral state (inputs to genes 1, 2 and 3 not shown). A hypothetical protein expression pattern for this system is also shown (b). Following duplication and degeneration, regulatory subfunctionalization arises for gene 4 (dotted interactions are lost). A new input from gene 3 means we additionally have neofunctionalization, i.e., subneofunctionalization. After further degeneration (a, right) regulatory subfunctionalization is lost, while neofunctionalization is retained. (c) All three post-duplication states (sub-, subneo-, neo-functionalization) will result in temporal subfunctionalization for gene 4, since in the second and third timesteps only the first copy (u4) is ON, whereas in the fifth and sixth timesteps only the second copy (v4) is ON.
Figure 3
Figure 3
Evolution of measures over time for a particular set of conditions (c = 0.45, D = 0). (a) Number of shared regulatory elements (H) between paralogous cis-regulatory elements declines over time. (b) Regulatory subfunctionalization (see Methods – Measures for paralogous genes) as a proportion of the number of eligible genes (defined as the number of rows with two or more nonzero entries), since we need to adjust for genes with N < 2, which cannot be subfunctionalized. (c) Neofunctionalization increases monotonically, then stabilizes. (d) Temporal subfunctionalization as a proportion of the number of genes. Graphs show median values and 95% confidence interval (errorbars) over 200 independent runs.
Figure 4
Figure 4
An example of the dominance effect following duplication. The inset (top left) gives an example time course for the protein products of the four genes. Regulation of gene 4 in the ancestral network includes two redundant interactions from genes 2 and 3, which cannot be removed in succession without perturbing the dynamics (since genes 2 and 3 have identical dynamics, their contributions cancel out). However, following duplication, these interactions can be lost successively (albeit in order, with the input from gene 3 degenerating first), since any dynamic perturbations will be masked by the intact second copy. Since the first copy now produces the correct dynamics, the degeneration process can be repeated in the second copy. Further degeneration might lead to a final state of complementation between the two copies.
Figure 5
Figure 5
Temporal subfunctionalization. Observed temporal subfunctionalization in vivo for the "elutriation" time course dataset. Ks values calculated for each yeast paralog (see Methods – Analysis of yeast data) are plotted against the correlation coefficient of the expression values. Paralogs for which temporal subfunctionalization is observed are shown with filled circles, those for which none is found are shown with open circles.
Figure 6
Figure 6
Rates of coinciding regulatory and temporal subfunctionalization. Rates of coinciding regulatory and temporal subfunctionalization under the same conditions as figure 3 (ci = 0.45, D = 0). The dotted line shows the product of the median independent frequencies. Graph shows median values and 95% confidence interval (errorbars) over 200 independent runs.

References

    1. Force A, Lynch M, Pickett FB, Amores A, Yan YL, Postlethwait J. Preservation of duplicate genes by complementary, degenerative mutations. Genetics. 1999;151:1531–1545. - PMC - PubMed
    1. Lynch M, Force A. The probability of duplicate gene preservation by subfunctionalization. Genetics. 2000;154:459–473. - PMC - PubMed
    1. Ferris SD, Whitt GS. Evolution of the differential regulation of duplicate genes after polyploidization. J Mol Evol. 1979;12:267–317. doi: 10.1007/BF01732026. - DOI - PubMed
    1. Hughes MK, Hughes AL. Evolution of duplicate genes in a tetraploid animal, Xenopus laevis. Mol Biol Evol. 1993;10:1360–1369. - PubMed
    1. White S, Doebley J. Of genes and genomes and the origin of maize. Trends Genet. 1998;14:327–332. doi: 10.1016/S0168-9525(98)01524-8. - DOI - PubMed

Publication types

LinkOut - more resources