

Comparative evaluation of gene-set analysis methods
- PMID: 17988400
- PMCID: PMC2238724
- DOI: 10.1186/1471-2105-8-431
Comparative evaluation of gene-set analysis methods
Abstract
Background: Multiple data-analytic methods have been proposed for evaluating gene-expression levels in specific biological pathways, assessing differential expression associated with a binary phenotype. Following Goeman and Bühlmann's recent review, we compared statistical performance of three methods, namely Global Test, ANCOVA Global Test, and SAM-GS, that test "self-contained null hypotheses" Via. subject sampling. The three methods were compared based on a simulation experiment and analyses of three real-world microarray datasets.
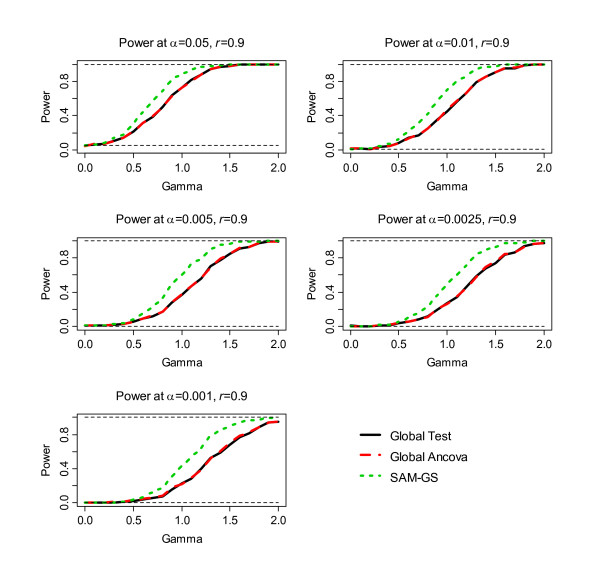
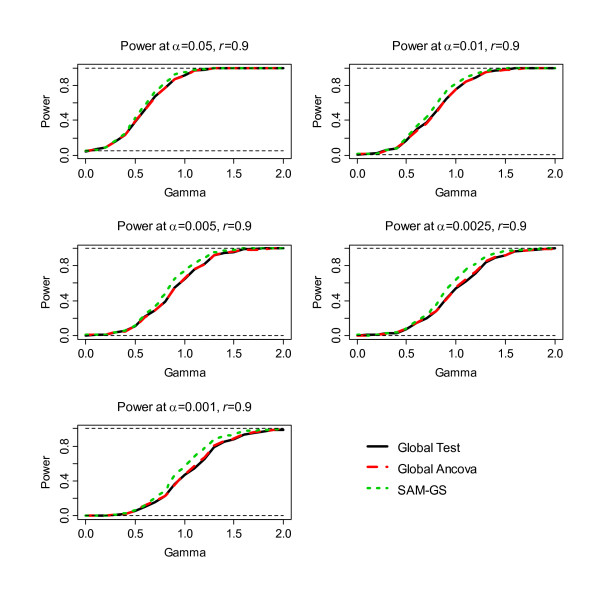
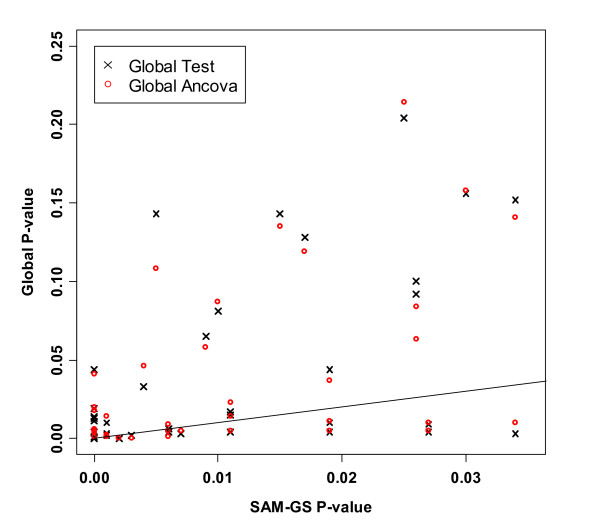
Results: In the simulation experiment, we found that the use of the asymptotic distribution in the two Global Tests leads to a statistical test with an incorrect size. Specifically, p-values calculated by the scaled chi2 distribution of Global Test and the asymptotic distribution of ANCOVA Global Test are too liberal, while the asymptotic distribution with a quadratic form of the Global Test results in p-values that are too conservative. The two Global Tests with permutation-based inference, however, gave a correct size. While the three methods showed similar power using permutation inference after a proper standardization of gene expression data, SAM-GS showed slightly higher power than the Global Tests. In the analysis of a real-world microarray dataset, the two Global Tests gave markedly different results, compared to SAM-GS, in identifying pathways whose gene expressions are associated with p53 mutation in cancer cell lines. A proper standardization of gene expression variances is necessary for the two Global Tests in order to produce biologically sensible results. After the standardization, the three methods gave very similar biologically-sensible results, with slightly higher statistical significance given by SAM-GS. The three methods gave similar patterns of results in the analysis of the other two microarray datasets.
Conclusion: An appropriate standardization makes the performance of all three methods similar, given the use of permutation-based inference. SAM-GS tends to have slightly higher power in the lower alpha-level region (i.e. gene sets that are of the greatest interest). Global Test and ANCOVA Global Test have the important advantage of being able to analyze continuous and survival phenotypes and to adjust for covariates. A free Microsoft Excel Add-In to perform SAM-GS is available from http://www.ualberta.ca/~yyasui/homepage.html.
Figures


Similar articles
-
Improving gene set analysis of microarray data by SAM-GS.BMC Bioinformatics. 2007 Jul 5;8:242. doi: 10.1186/1471-2105-8-242. BMC Bioinformatics. 2007. PMID: 17612399 Free PMC article.
-
Gene-set analysis and reduction.Brief Bioinform. 2009 Jan;10(1):24-34. doi: 10.1093/bib/bbn042. Epub 2008 Oct 4. Brief Bioinform. 2009. PMID: 18836208 Free PMC article. Review.
-
Linear combination test for gene set analysis of a continuous phenotype.BMC Bioinformatics. 2013 Jul 1;14:212. doi: 10.1186/1471-2105-14-212. BMC Bioinformatics. 2013. PMID: 23815123 Free PMC article.
-
Gene set enrichment analysis for multiple continuous phenotypes.BMC Bioinformatics. 2014 Aug 3;15(1):260. doi: 10.1186/1471-2105-15-260. BMC Bioinformatics. 2014. PMID: 25086605 Free PMC article.
-
Differential network analysis in human cancer research.Curr Pharm Des. 2014;20(1):4-10. doi: 10.2174/138161282001140113122316. Curr Pharm Des. 2014. PMID: 23530503 Free PMC article. Review.
Cited by
-
Gene set analysis methods: statistical models and methodological differences.Brief Bioinform. 2014 Jul;15(4):504-18. doi: 10.1093/bib/bbt002. Brief Bioinform. 2014. PMID: 23413432 Free PMC article.
-
Gene set analysis for self-contained tests: complex null and specific alternative hypotheses.Bioinformatics. 2012 Dec 1;28(23):3073-80. doi: 10.1093/bioinformatics/bts579. Epub 2012 Oct 7. Bioinformatics. 2012. PMID: 23044539 Free PMC article.
-
Error control variability in pathway-based microarray analysis.Bioinformatics. 2009 Sep 1;25(17):2216-21. doi: 10.1093/bioinformatics/btp385. Epub 2009 Jun 26. Bioinformatics. 2009. PMID: 19561020 Free PMC article.
-
A biological evaluation of six gene set analysis methods for identification of differentially expressed pathways in microarray data.Cancer Inform. 2008;6:357-68. doi: 10.4137/cin.s867. Epub 2008 Jun 20. Cancer Inform. 2008. PMID: 19259416 Free PMC article.
-
Extracting the Strongest Signals from Omics Data: Differentially Expressed Pathways and Beyond.Methods Mol Biol. 2017;1613:125-159. doi: 10.1007/978-1-4939-7027-8_7. Methods Mol Biol. 2017. PMID: 28849561 Free PMC article.
References
-
- Mootha VK, Lindgren CM, Eriksson KF, Subramanian A, Sihag S, Lehar J, Puigserver P, Carlsson E, Ridderstrale M, Laurila E, Houstis N, Daly MJ, Patterson N, Mesirov JP, Golub TR, Tamayo P, Spiegelman B, Lander ES, Hirschhorn JN, Altshuler D, Groop LC. PGC-1alpha-responsive genes involved in oxidative phosphorylation are coordinately downregulated in human diabetes. Nat Genet. 2003;34:267–273. doi: 10.1038/ng1180. - DOI - PubMed
-
- Subramanian A, Tamayo P, Mootha VK, Mukherjee S, Ebert BL, Gillette MA, Paulovich A, Pomeroy SL, Golub TR, Lander ES, Mesirov JP. Gene set enrichment analysis: a knowledge-based approach for interpreting genome-wide expression profiles. Proc Natl Acad Sci USA. 2005;102:15545–15550. doi: 10.1073/pnas.0506580102. - DOI - PMC - PubMed
Publication types
MeSH terms
LinkOut - more resources
Full Text Sources
Other Literature Sources
Research Materials
Miscellaneous
