. 2008 Sep;136(9):1281-9.
doi: 10.1017/S0950268807009776. Epub 2007 Nov 8.

Rotavirus infections and climate variability in Dhaka, Bangladesh: a time-series analysis

Affiliations

Rotavirus infections and climate variability in Dhaka, Bangladesh: a time-series analysis

M Hashizume et al. Epidemiol Infect. 2008 Sep.

Abstract

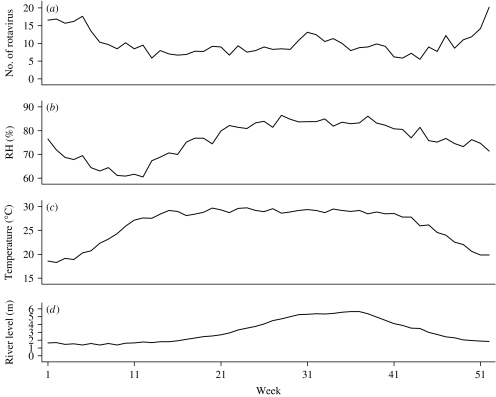
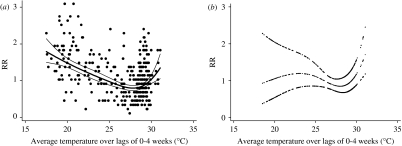
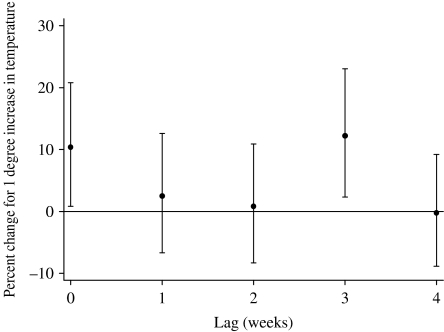
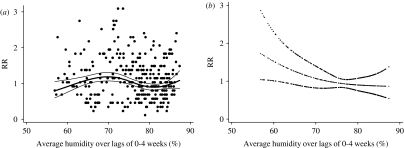
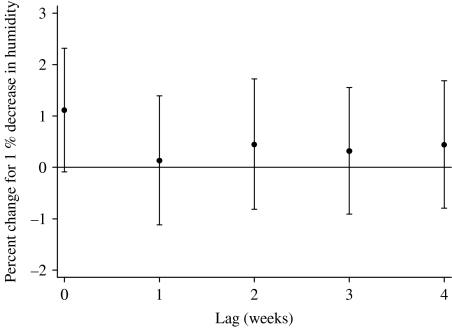
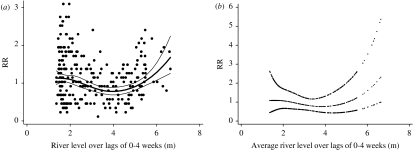
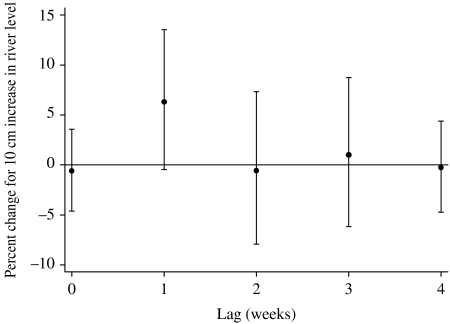
Attempts to explain the clear seasonality of rotavirus infections have been made by relating disease incidence to climate factors; however, few studies have disentangled the effects of weather from other factors that might cause seasonality. We investigated the relationships between hospital visits for rotavirus diarrhoea and temperature, humidity and river level, in Dhaka, Bangladesh, using time-series analysis adjusting for other confounding seasonal factors. There was strong evidence for an increase in rotavirus diarrhoea at high temperatures, by 40.2% for each 1 degrees C increase above a threshold (29 degrees C). Relative humidity had a linear inverse relationship with the number of cases of rotavirus diarrhoea. River level, above a threshold (4.8 m), was associated with an increase in cases of rotavirus diarrhoea, by 5.5% per 10-cm river-level rise. Our findings provide evidence that factors associated with high temperature, low humidity and high river-level increase the incidence of rotavirus diarrhoea in Dhaka.


Figures

Fig. 1
Fig. 1
Seasonal variations of (a) number of rotavirus diarrhoea patients, (b) relative humidity (RH), (c) temperature and (d) river-level data in Dhaka, 1996–2001.
Fig. 2
Fig. 2
Relationship between relative risk (RR) of rotavirus diarrhoea (scaled to the mean weekly number of rotavirus diarrhoea cases) and average temperature over lags of 0–4 weeks (shown as a 3 d.f. natural cubic spline). (a) Crude relationship and (b) relationship adjusted for humidity, river level, seasonal patterns, between-year variations and public holidays. The centre line in each graph shows the estimated spline curve, and the upper and lower lines represent the 95% confidence limits.
Fig. 3
Fig. 3
Percent change (and 95% CIs) for high temperature effects of varying periods of risks on rotavirus diarrhoea (unconstrained distributed lag models). Percent change shows the change in the number of the cases for every 1°C increase above the threshold (29°C).
Fig. 4
Fig. 4
Relationship between relative risk (RR) of rotavirus diarrhoea (scaled to the mean weekly number of rotavirus diarrhoea) and average humidity over lags of 0–4 weeks (shown as a 3 d.f. natural cubic spline). (a) Crude relationship and (b) relationship adjusted for temperature, river level, seasonal patterns, between-year variations and public holidays. The centre line in each graph shows the estimated spline curve, and the upper and lower lines represent the 95% confidence limits.
Fig. 5
Fig. 5
Percent change (and 95% CIs) for humidity effects of varying periods of risks on rotavirus diarrhoea (unconstrained distributed lag models). Percent change shows the change in the number of the cases for every 1% decrease in relative humidity.
Fig. 6
Fig. 6
Relationship between relative risk (RR) of rotavirus diarrhoea (scaled against the mean weekly number of rotavirus diarrhoea) and average river level over lags of 0–4 weeks (shown as a 3 d.f. natural cubic spline). (a) Crude relationship and (b) relationship adjusted for humidity, temperature, seasonal patterns, between-year variations and public holidays. The centre line in each graph shows the estimated spline curve, and the upper and lower lines represent the 95% confidence limits.
Fig. 7
Fig. 7
Percent change (and 95% CIs) for high river-level effects of varying periods of risks on rotavirus diarrhoea (unconstrained distributed lag models). Percent change shows the change in the number of the cases for every 10 cm increase above the threshold (4·8 m).

Similar articles

Cited by

References

    1. Parashar UD et al. Global illness and deaths caused by rotavirus disease in children. Emerging Infectious Diseases. 2003;9:565–572. - PMC - PubMed
    1. Glass RI et al. The epidemiology of rotavirus diarrhea in the United States: surveillance and estimates of disease burden. Journal of Infectious Diseases. 1996;174:S5–11. (Suppl. 1): - PubMed
    1. Konno T et al. Influence of temperature and relative humidity on human rotavirus infection in Japan. Journal of Infectious Diseases. 1983;147:125–128. - PubMed
    1. Nakagomi T et al. Incidence and burden of rotavirus gastroenteritis in Japan, as estimated from a prospective sentinel hospital study. Journal of Infectious Diseases. 2005;192:S106–110. (Suppl. 1): - PubMed
    1. Bresee J et al. First report from the Asian Rotavirus Surveillance Network. Emerging Infectious Diseases. 2004;10:988–995. - PMC - PubMed

Publication types