

doi: 10.1016/j.neuron.2007.08.017.
Gradual changes in hippocampal activity support remembering the order of events
Affiliations
- PMID: 17988635
- PMCID: PMC2104541
- DOI: 10.1016/j.neuron.2007.08.017
Item in Clipboard
Gradual changes in hippocampal activity support remembering the order of events
Neuron.
.
Abstract
The hippocampus is thought to contribute to episodic memory in part by binding stimuli to their spatiotemporal context. The present study examined how hippocampal neuronal populations encode spatial and temporal context as rats performed a task in which they were required to remember the order of trial-unique sequences of odors. The results suggest that a gradual change in the pattern of hippocampal activity served as a temporal context for odor-sampling events and was important for successful subsequent memory of the order of those odors.
Figures
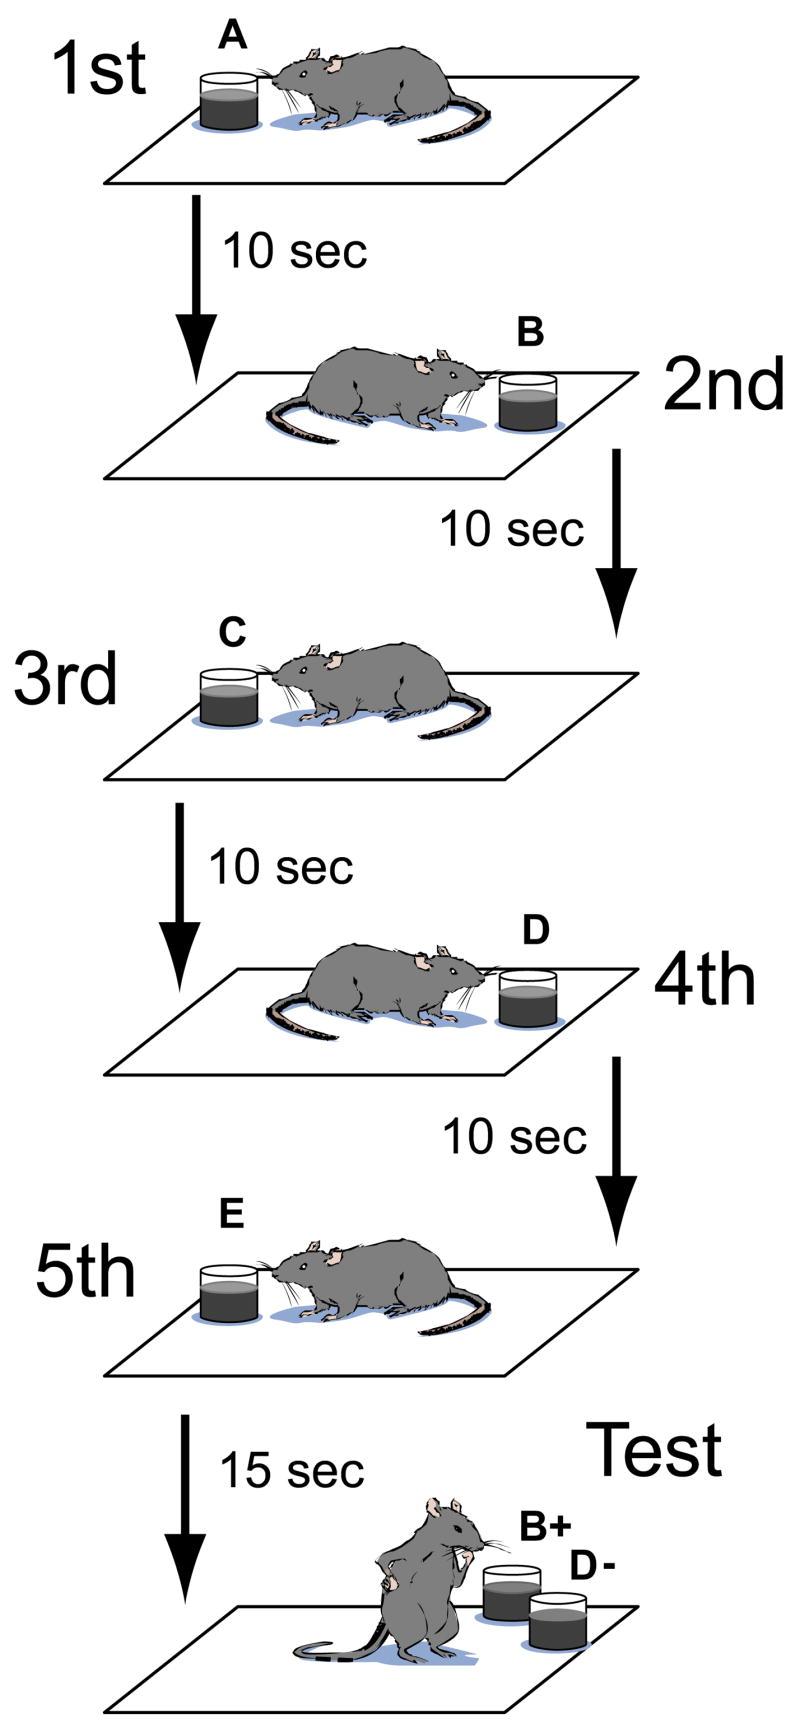
Schematic of the task. On each trial, rats alternated between left and right sides of the enclosure as they encountered a trial-unique sequence of 5 odors. Rats were then probed with a non-adjacent pair of the odors and were rewarded for selecting the odor that had appeared earlier in the sample sequence.
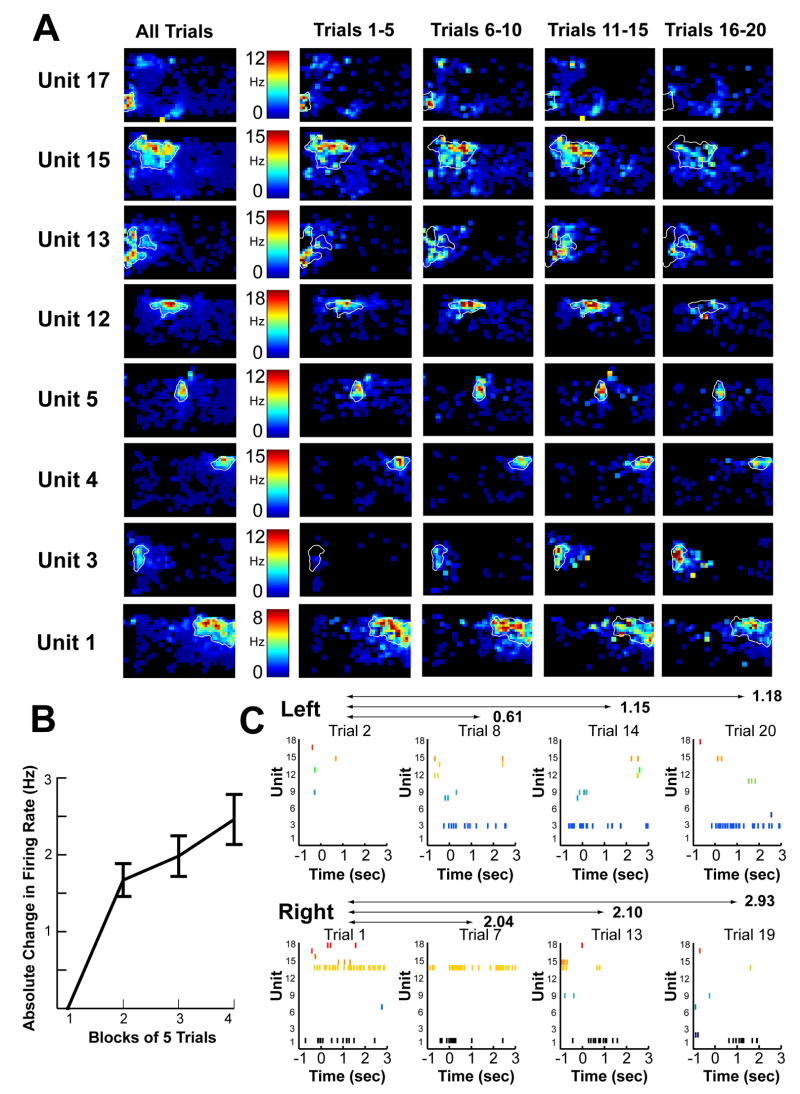
Examples of gradual changes in hippocampal firing across a testing session. A. Example of hippocampal firing rates as a function of the rat’s location in a rectangular testing enclosure for the 8 (out of 18) pyramidal cells that met the criterion for exhibiting at least one place field in this example session. The results are shown for the entire test session (leftmost column) and separately for blocks of five trials (rightmost four columns). B. Average absolute change in in-field firing rate for all pyramidal units with place fields from all sessions used in the study. Some cells showed increases in in-field firing rates, whereas others showed decreases or no changes, and thus the graph shows absolute differences relative to the first block of trials (as a consequence, block 1 is shown as 0; effect of block for blocks 2–4: F=1.76, p=.01). C. Example rasters for trials 2, 8, 14, and 20 (all of which occurred on the left side of the testing enclosure) and for trials 1, 7, 13, and 19 (all of which occurred on the right side of the testing enclosure) for the same example session shown in A. The numbers above double arrows indicate the Distance Index between the events (all events were from the 4th ordinal position on each trial).
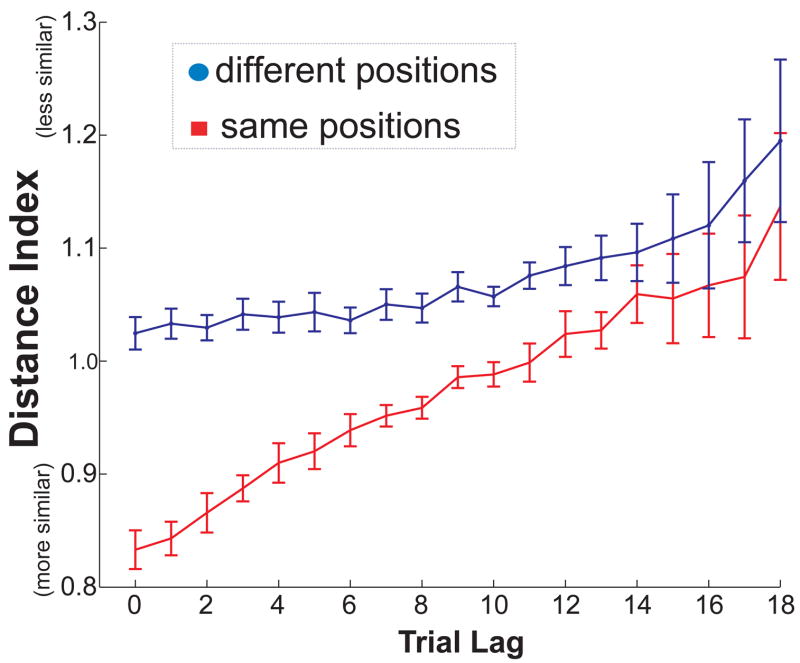
Similarity of ensemble responses according to temporal lag between trials. Results from odors encountered in the same position (red) are plotted separately from odors encountered in different positions (blue). A lower Distance Index corresponds to greater similarity. Error bars show SEM for the variability across the 19 sessions analyzed.
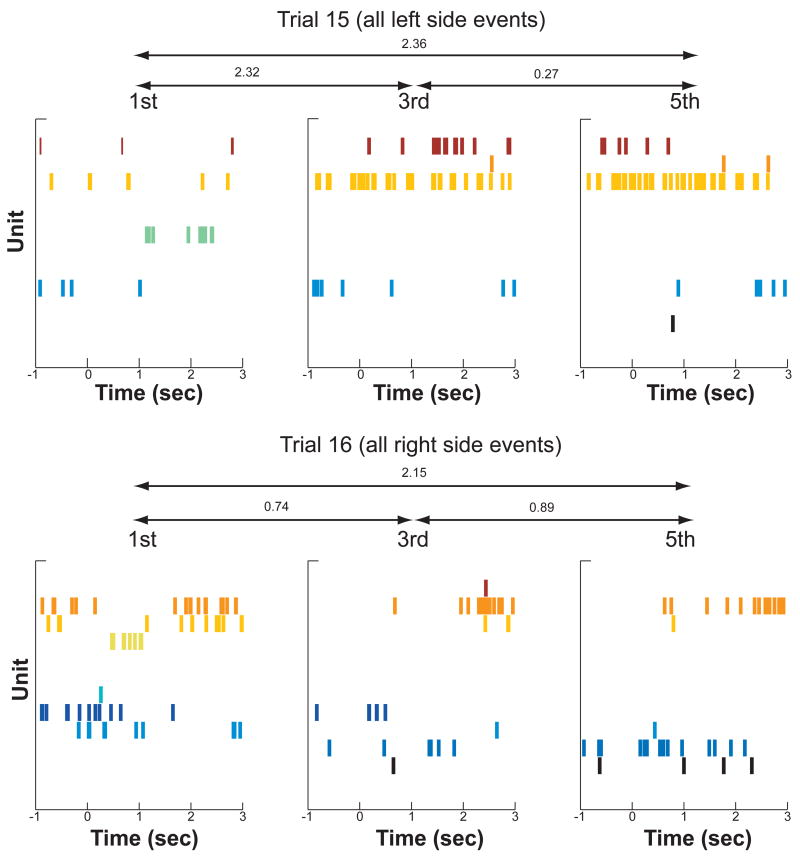
Example from one session of changes in the pattern of hippocampal activity within a trial. The top row of graphs show the 1st, 3rd and 5th events on trial 15 of this session. Because the rat alternated sides of the testing enclosure, these events all occurred on the left side of the enclosure. The bottom row shows the 1st, 3rd, and 5th events on trial 16 of the same session. These events all occurred on the right side of the enclosure, and the difference in pattern of activity between the top row and bottom row illustrates the influence of location on the hippocampal ensemble response. The difference between events within a trial illustrates the effect of temporal context on the hippocampal ensemble, and the numbers above the double arrows show the Distance Indices for the indicated comparison.
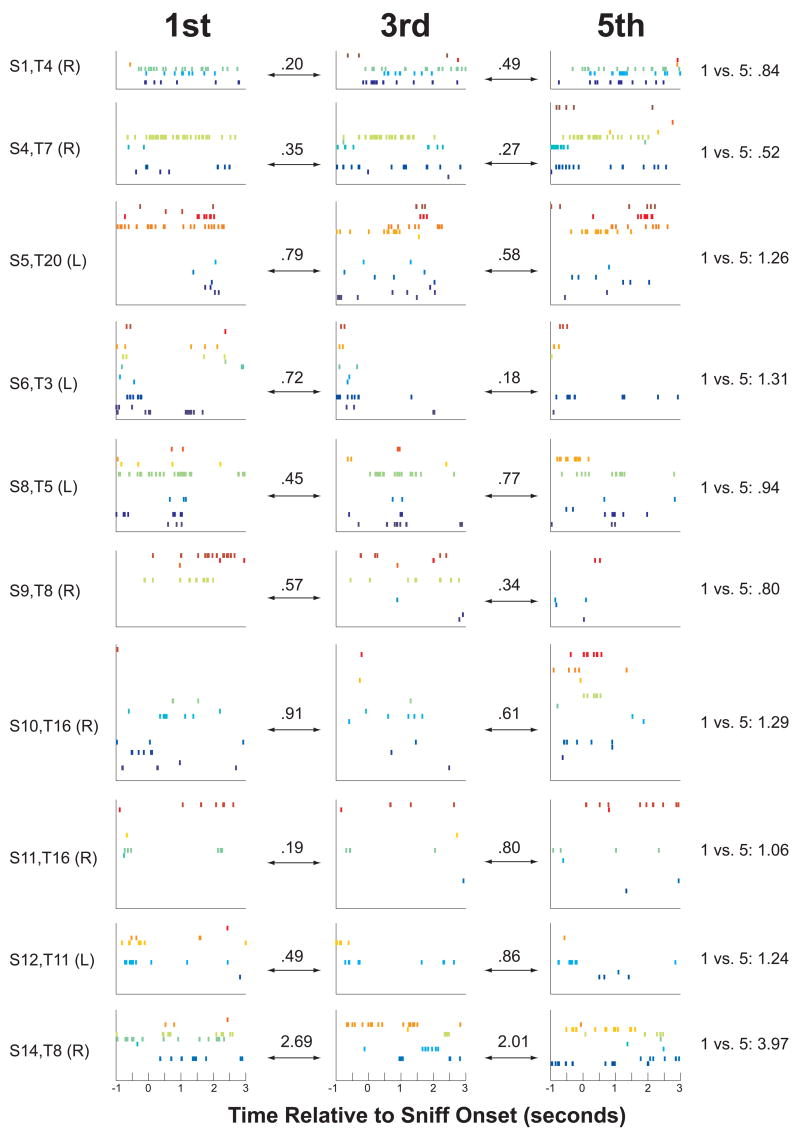
Examples of changes in the pattern of hippocampal activity within a trial from 10 different sessions. Each row of graphs is taken from a different session and shows activity from the 1st, 3rd, and 5th odor from one trial. The numbers above the double arrows (and in the rightmost column) show the Distance Indices for the indicated comparison. The session number, trial number, and right/left side of the enclosure are indicated by text to the left of each row (in the format “S[session number], T[trial number] (L[eft]/R[ight])”).
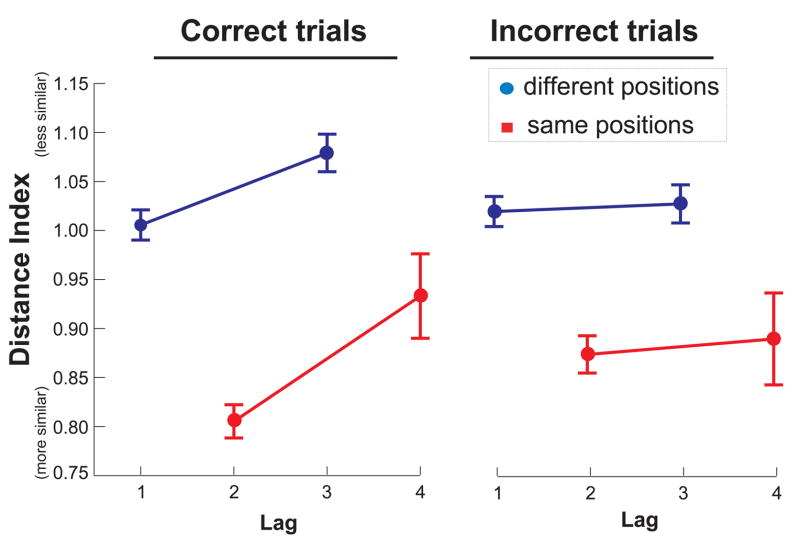
Similarity of ensemble responses according to temporal lag between odors encountered during the sample phase. Results from odors encountered in the same position (red) are plotted separately from odors encountered in different positions (blue). In addition, results from trials that were subsequently performed correctly are plotted separately from incorrect trials. A lower Distance Index corresponds to greater similarity. Error bars show SEM for the variability across the 19 sessions analyzed.
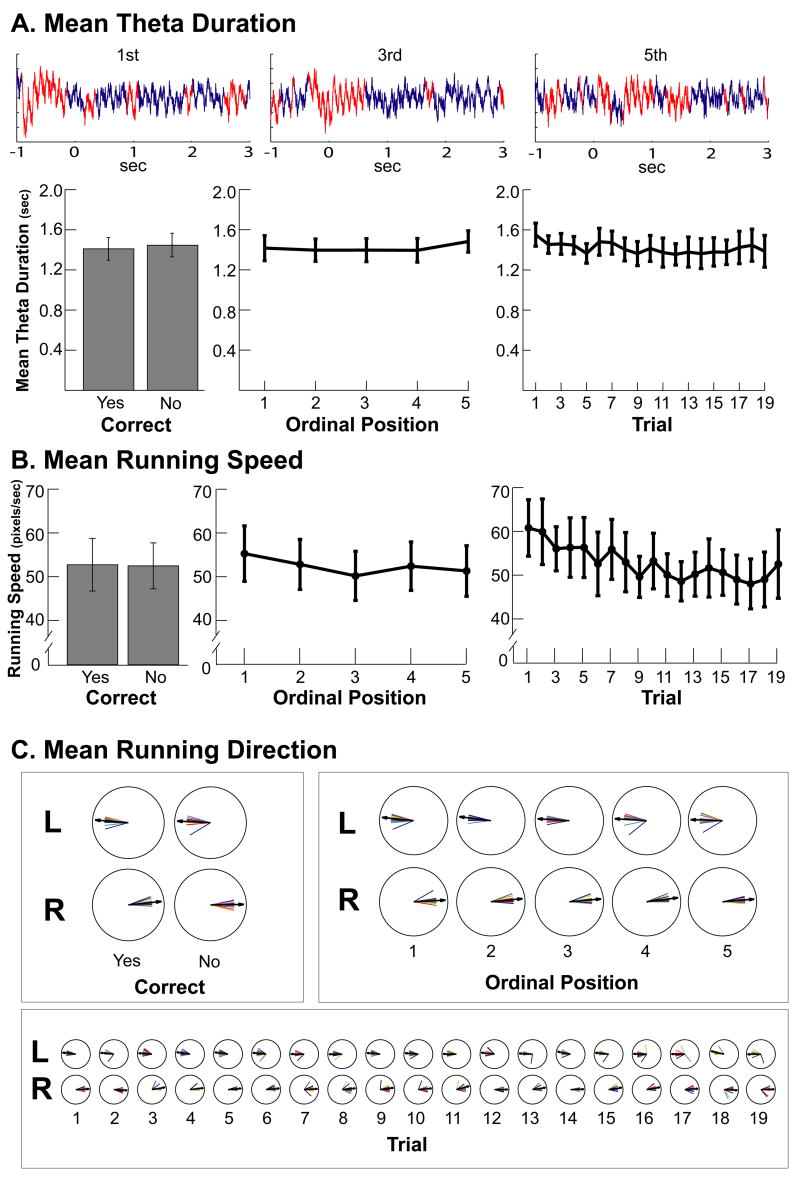
A. Mean theta duration. Example traces of the local field potential (recorded in the pyramidal layer; 1–400 Hz) are shown that represent the first, third, and fifth sampling events from one trial. The local field potential was divided into theta-present (red) and theta-absent sections (blue; see text). The amount of time spent in hippocampal theta did not differ between correct and incorrect events (t(18)=1.00, p > .1), across ordinal positions (F(4,18)=1.37, p>.1), or across trials (F(18,18)=0.62, p >.1). B. Mean running speed. The mean running speed did not differ between correct and incorrect events (event = 1 sec prior to onset of sniffing to 4 seconds later; t(14)=0.18, p > .1), but showed a slight decrease across ordinal positions (F(4,14)=4.97, p<.01; this difference was equivalent on correct and incorrect trials, see text) and across trials (F(18,14)=2.61, p <.01). Nevertheless, the main results regarding temporal context were unchanged when the spiking data was considered only when the rat was stationary (see text). 50 pixels/sec corresponded to 13.9 cm/sec. C. Running Direction. The polar plots show the mean running direction for each session (colored lines) and the average for all sessions (black arrows). The mean running direction was similar for correct and incorrect events, for all ordinal positions, and for all trials. Position data (and therefore running speed and running direction) was unavailable for 4 sessions (see text).
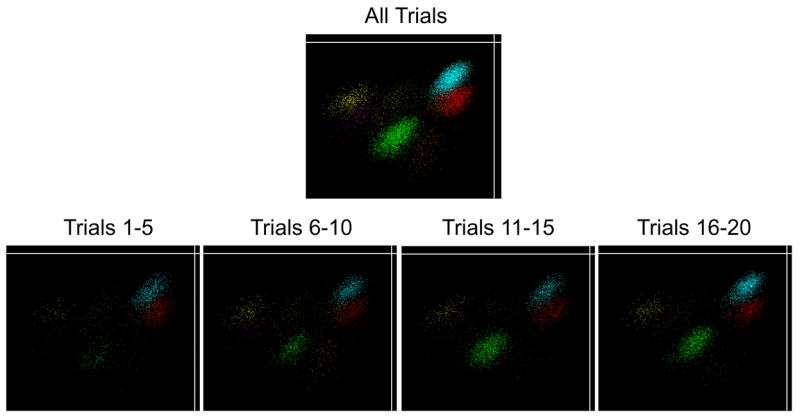
Example data from one tetrode showing similar cluster projections across quartiles of the session. Individual points correspond to neuronal spikes and are colored to represent the different units recorded on this tetrode. The Y axis shows the amplitude of each spike as it was recorded on one wire of the tetrode, and the X axis shows the amplitude of another wire from the same tetrode. The clusters are similar in each of the quartiles, indicating that no tetrode movement occurred. The green cluster corresponds to Unit 2 in Figure 2, a neuron that showed changes in firing rate over the session without showing any evidence of tetrode movement (although the change in firing rate for that unit is apparent as an increase in the number of spikes in the cluster across the quartiles).
References
-
- Brown GDA, McCormack T. The role of time in human memory and binding: a review of the evidence. In: Zimmer HD, Mecklinger A, Lindenberger U, editors. Handbook of binding and memory: perspectives from cognitive neuroscience. Oxford: Oxford University Press; 2006. pp. 251–290.
-
- Burgess N, Hitch G. Computational models of working memory: putting long-term memory into context. Trends Cog Sci. 2005;9:535–41. - PubMed
-
- Buzsaki G, Draguhn A. Neuronal oscillations in cortical networks. Science. 2004;304:1926–1929. - PubMed
-
- Dragoi G, Buzsaki G. Temporal encoding of place sequences by hippocampal cell assemblies. Neuron. 2006;50:145–57. - PubMed
Publication types
MeSH terms
Grants and funding
LinkOut - more resources
Full Text Sources
Other Literature Sources
Medical
